Statistics Essentials For Dummies (44 page)

1. Find the slope,
m
, of the best-fitting line using the steps listed in the preceding section.
2. Multiply by
.
3. Subtract your result from
.
To save a great deal of time calculating the best-fitting line, keep in mind that five well-known summary statistics are all you need to do all the necessary calculations. I call them the "big-five statistics
"
(not to be confused with the five-number summary from Chapter 2):
1. The mean of the
x
-values (denoted)
2. The mean of the
y
-values (denoted)
3. The standard deviation of the
x-
values (denoted
s
x
)
4. The standard deviation of the
y
-values (denoted
s
y
)
5. The correlation between
X
and
Y
(denoted
r
)
(This chapter and Chapter 2 contain formulas and step-by-step instructions for these statistics.)
Interpreting the slope and y-intercept
Even more important than being able to calculate the slope and
y
-intercept to form the best-fitting regression line is the ability to interpret their values.
Interpreting the slope
The slope is interpreted in algebra as "rise over run." If the slope for example is 2, you can write this as 2/1 and say as
X
increases by 1,
Y
increases by 2, and that's how you move along from point to point on the line. In a regression context, the slope is the heart and soul of the equation because it tells you how much you can expect
Y
to change as
X
increases.
In general, the units for slope are the units of the
Y
-variable per units of the
X
-variable. It's a ratio of change in
Y
per change in
X
. Suppose in studying the effect of dosage level in milligrams (mg) on blood pressure, a researcher finds that the slope of the regression line is -2.5. You can write this as -2.5/1 and say blood pressure is expected to decrease by 2.5 points on average per 1 mg increase in drug dosage.
If using a 1 in the denominator of slope is not super-meaningful, you can multiply the top and bottom by any number (as long as it's the same number) and interpret it that way instead. In the blood pressure example, instead of writing slope as -2.5/1 and interpreting it as a decrease of 2.5 points per 1 mg increase of the drug, we can multiply the top and bottom by ten to get -25/10 and say an increase in dosage of 10 mg results in a 25-point decrease in blood pressure.
Interpreting the y-intercept
The
y
-intercept is the place where the regression line
y = mx + b
crosses the
y
-axis and is denoted by
b
(see earlier section "The
y
-intercept of the regression line"). Sometimes the
y
-intercept can be interpreted in a meaningful way, and sometimes not. This differs from slope, which is always interpretable. In fact, between the two elements of slope and intercept, the slope is the star of the show, with the
y-
intercept serving as the less famous but still noticeable sidekick.
There are times when the
y
-intercept makes no sense. For example, suppose you use rain to predict bushels per acre of corn; if the regression line crosses the
y
-axis somewhere below zero (and it most likely will), the
y
-intercept will make no sense. You can't have negative corn production.
Another situation when it's not okay to interpret the
y
-intercept is if there is no data near the point where
x
= 0. For example, suppose you want to use students' scores on Midterm 1 to predict their scores on Midterm 2. The
y
-intercept represents a prediction for Midterm 2 when the score on Midterm 1 is zero. You don't expect scores on a midterm to be at or near zero unless someone did not take the exam, in which case their score would not be included in the first place.
Many times, however, the
y
-intercept is of interest to you, it has meaning, and you have data collected in that area (where
x
= 0). For example, if you're predicting coffee sales at Green Bay Packer games using temperature, some games have temperatures at or even below zero, so predicting coffee sales at these temperatures makes sense. (As you might guess, they sell more and more coffee as the temperature dips.)
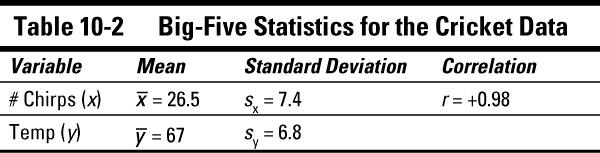
The best-fitting line for the crickets
The "big-five" statistics from the subset of cricket data are shown in Table 10-2.