Statistics Essentials For Dummies (46 page)

Yet, this condition is often ignored as the media gives us headlines such as "Doctors can lower malpractice lawsuits by spending more time with patients." In reality, it was found that doctors who have fewer lawsuits are the type of doctor who spends a lot of time with patients. But that doesn't mean taking a bad doctor and having him spend more time with his patients will reduce his malpractice suits; in fact, spending more time with him might create even more problems.
And we can't say that crickets chirping faster will cause the temperature to increase, of course, but we do know we can count cricket chirps and do a pretty good job predicting temperature nonetheless, through simple linear regression.
Chapter 11
:
Two-Way Tables
In This Chapter
Organizing probabilities in two-way tables
Categorical variables place individuals into groups based on certain possible outcomes. For example, gender (male, female) whether you ate breakfast this morning (yes, no), or political affiliation (Democrat, Republican, Independent, Other). Oftentimes you look for relationships between two categorical variables; for example, "Are females more likely to eat breakfast than males?" A
two-way table
classifies individuals into groups based on all possible pairs of outcomes of two categorical variables (for example, male breakfast eaters, female breakfast eaters, and so on) In this chapter you see how two-way tables help you organize and figure probabilities and check for independence of two events.
Organizing and Interpreting a Two-way Table
Suppose you are a basketball nut and you love to watch your favorite player shoot free throws. After watching him shoot pairs of free throws for a long time, you notice two things. First, it seems like he makes the second shot more often than he makes the first. You also believe, based on your observations, that when he misses the first shot, he makes the second
one even more often. You always thought that free throw attempts were independent and that the outcome of one shot didn't influence the outcome of another, but in this case, you suspect there is a relationship after all, for this player at least. So you launch your own statistical investigation to find out.
Suppose you collect data on this player during 155 different trips to the free throw line. Each time he shoots a pair of free throws you record the outcomes. Examining your data you see he made the first shot and missed the second one 40 times; 60 times he made both free throws; 10 times he missed both; and 45 times he missed the first one and made the second.
The next step is to organize your data into a two-way table. The following sections take you through it.
Defining the outcomes
The first step in setting up a two-way table is to define the sample space and the outcomes of the experiment using probability notation. In the free throw example, your first categorical variable is the outcome of the first throw. This variable has two possible outcomes: 1) he made the first free throw (indicated by
Y
1
); or 2) he missed the first free throw (indicated by
N
1
). Similarly, the second categorical variable is the outcome of the second shot; its outcomes,
Y
2
and
N
2
, represent making and missing the second shot, respectively.
The sample space,
S
, lists all possible pairs of outcomes of this two-variable data. Because each variable has 2 possible outcomes, there are 2 ∗ 2 = 4 pairs of possible outcomes for the pair of free throws:
S
= {
Y1Y2
;
Y1N2
;
N1Y2
; and
N1N2
}
Setting up the rows and columns
You can organize the two-way table using rows to represent one variable (the outcome of the first free throw) and columns to represent the other variable (the outcome of the second free throw). Table 11-1 shows what the two-way table looks like.
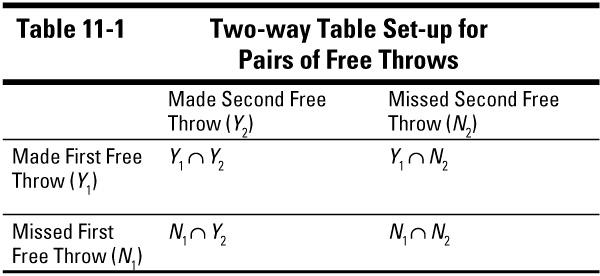
Notice the table has 2 ∗ 2 = 4 boxes in it. These boxes are called the cells of the two-way table. Each
cell
represents an intersection of a row and column. For example the cell in the upper right-hand corner of the table represents the outcome where the player made the first free throw and missed the second one. In probability notation, this represents the intersection of the outcomes
Y
1
and
N
2
, written as
Y
1N
2
. I wrote in the events represented by each cell of the free throw two-way table in Table 11-1.
Inserting the numbers
Remember that the player made the first free throw and missed the second a total of 40 times; 60 times he made both free throws; 10 times he missed both; and 45 times he missed the first one and made the second. Now enter the basketball data into a two-way table and calculate probabilities.
Looking at the labels on the rows and columns, you see 60 goes into the upper left cell (represented by the event
Y
1Y
2
), 40 goes into the upper right cell (represented by the event
Y
1N
2
), 45 is in the bottom left cell (represented by
N
1Y
2
), and 10 is in the bottom right (represented by the event
N
1N
2
). The number of individuals inside of a cell in row
i
and column
j
of a two-way table is called the
cell count
for the (
i
,
j
)
th
cell. Table 11-2 shows the two-way table with the cell counts.