Statistics Essentials For Dummies (42 page)

1.
is 12/3 = 4, and
is 9/3 = 3.
2. The standard deviations are calculated to be
s
x
= 1.73 and
s
y
= 1.00.
3. The differences found in Step 3 multiplied together are: (3
-
4)(2
-
3) = (
-
1)(
-
1) = 1; (3
-
4)(3
-
3) = (
-
1)(0) = 0; (6
-
4)(4
-
3) = (
+
2)(
+
1) =
+
2.
4. Adding the Step 3 results, you get 1
+
0
+
2 = 3.
5. Dividing by
s
x
∗
s
y gives you 3/(1.73
∗
1.00) = 3/1.73 = 1.73.
6. Now divide the Step 5 result by 3 - 1 (which is 2) and you get the correlation
r
= 0.87.
Interpreting the correlation
The correlation
r
is always between +1 and -1. Here is how you interpret various values of
r
. A correlation that is
Exactly -1 indicates a perfect downhill linear relationship.
Close to -1 indicates a strong downhill linear relationship.
Close to 0 means no linear relationship exists.
Close to +1 indicates a strong uphill linear relationship.
Exactly +1 indicates a perfect uphill linear relationship.
How "close" do you have to get to -1 or +1 to indicate a strong linear relationship? Most statisticians like to see correlations above +0.60 (or below -0.60) before getting too excited about them. Don't expect a correlation to always be +0.99 or -0.99; real data aren't perfect.
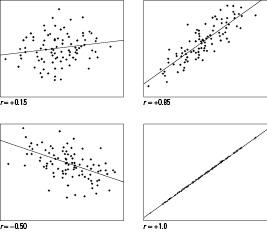
Figure 10-2 shows examples of what various correlations look like in terms of the strength and direction of the relationship.
Figure 10-2:
Scatterplots with various correlations.
For my subset of the cricket chirps versus temperature data, I calculated a correlation of 0.98, which is almost unheard of in the real world (these crickets are
good!
).
Properties of the correlation
Here are two important properties of correlation:
The correlation is a unitless measure. This means that if you change the units of
X
or
Y,
the correlation doesn't change. For example, changing the temperature (
Y
) from Fahrenheit to Celsius won't affect the correlation between the frequency of chirps and the outside temperature.

