Statistics Essentials For Dummies (41 page)

Figure 10-1:
Scatterplot of cricket chirps versus outdoor temperature.
Measuring Relationships Using the Correlation
After the bivariate data have been organized, the next step is to do some statistics that can quantify or measure the extent and nature of the relationship.
Calculating the correlation
The pattern and direction of the relationship between
X
and
Y
can be seen from the scatterplot. The strength of the relationship between two numerical variables depends on how closely the data resemble a certain pattern. Although many different types of patterns can exist between two variables, this chapter examines linear patterns only.
Statisticians use the
correlation coefficient
to measure the strength and direction of the linear relationship between two numerical variables
X
and
Y
. The correlation coefficient for a sample of data is denoted by
r.
Although the street definition of
correlation
applies to any two items that are related (such as gender and political affiliation), statisticians only use this term in the context of two numerical variables. The formal term for correlation is the
correlation coefficient
. Many different correlation measures have been created; the one in our case is the Pearson correlation coefficient (I'll just call it the correlation).
The formula for the correlation (
r
) is
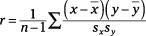
where
n
is the number of pairs of data;and
are the sample means; and
s
x
and
s
y
are the sample standard deviations of the
x
- and
y-
values, respectively.
To calculate the correlation
r
from a data set:
1. Find the mean of all the
x
-values () and the mean of all the
y
-values ().
See Chapter 2 for information on the mean.
2. Find the standard deviation of all the
x
-values (call it
s
x
) and the standard deviation of all the
y
-values (call it
s
y
).
See Chapter 2 for information on standard deviation.
3. For each (
x
,
y
) pair in the data set, take
x
minusand
y
minus, and multiply them together.
4. Add up all the results from Step 3.
5. Divide the sum by
sx
∗
sy
.
6. Divide the result by
n
-
1, where
n
is the number of (
x
,
y
) pairs.
This gives you the correlation
r
.
For example, suppose you have the data set (3, 2), (3, 3), and (6, 4). Following the preceding steps, you can calculate the correlation coefficient
r
via the following steps. (Note that for this data the
x
-values are 3, 3, 6, and the
y
-values are 2, 3, 4.)