Nonplussed! (45 page)
Authors: Julian Havil

Richard Guy has established the fact in his own way by producing the flowchart for the process. Writing the contents of the 2 and 5 registers as
t
and
r
, respectively, and realizing that
t + r = n
and also writing the contents of the 3 and 7 registers as
s
and
q
and realizing that
s+q = d
, he produced
figure 14.10
, which is equivalent to
figure 14.9
.
In 1999 Devin Kilminster of the University of Western Australia gave a talk on how Conway’s fourteen fractions can be reduced to the ten; those fractions are

where the initial value for
N
is 10 and the primes are generated by subsequent powers of 10.
Of course, this is a theoretical process. We have seen with PRIMEGAME just how many steps it takes to generate the first few primes and, in fact, Richard Guy gave the following formula for the number of steps needed to inspect the number
n
for primeness:

where
b < n
is the biggest divisor of
n
; for prime
n
,
b
is, of course, 1.
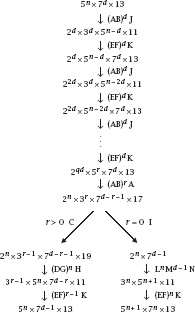
Figure 14.10.
Prime loops at work.
To form some idea of just how this accumulates, we can follow Guy’s thoughts as he answered Conway’s own question about how many steps are needed for PRIMEGAME to generate the thousandth prime (8831). To answer this we must compute the sum of the expression from
n =
2 to
n =
8831, which results in the number 1 378 197 377 195 ≈ 1.4 × 10
12
.
Perhaps this is slow, but a look at PIGAME puts this into perspective. Starting with
N
= 89 × 2
n
, the following fraction list computes the
n
th digit of π = 3.141 59 …; that is, it stops with
2π

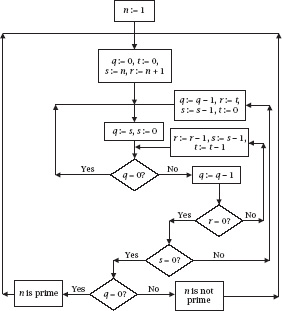
Figure 14.11.
The Guy flowchart.
More explicitly, with
n =
0 the machine stops at 3, with
n =
1 the machine stops at 1,
n =
2 the machine stops at 4, and so on. This is all very well, but Bill Dubuque has commented that
PIGAME computes the
n
th digit of
p
by using over 4×2
10
n
terms of Wallis’s product , which makes it in practice unrealistic for
n
> 1.
In the end, PRIMEGAME is simply a striking example of the programming language Fractran, which Conway has shown capable of simulating any computable process, just as his famous game of Life is capable of doing.

Fast cars, fast women, fast algorithms… what more could a man want?
Joe Mattis
Ethnomathematics
Southwest Africa finds its most celebrated place on the mathematical map on the border of Uganda and Zaire, since it was there in 1960 that the Belgian geologist Jean de Heinzelin discovered on the shores of Lake Edward the ancient Ishango Bone; its provenance is disputed with its date varying from 8000 to 20 000 b.c.e. and its purpose from a lunar calendar to a list of prime numbers. Yet there are other African ethnomathematical treasures, and the attractive designs which have featured at the start of each of the book’s chapters point to one such: sona, or in singular lusona. These are examples of a small but rich part of the cultural heritage of the Chokwe (pronounced
Chockway
) group of the Bantu people of northeast Angola (whose lands spill into Zambia and Zaire). The Chokwe are renowned for their figurative and decorative art with sona integrating this art with their wider culture, and also with mathematics. We will take a brief look at that quite surprising mathematical connection.
The Mathematics of the Motifs
To construct a design, imagine the dots to be one unit apart and a rectangular grid of them surrounded by a rectangle of mirrors extending half a unit outside them. The construction algorithm is:
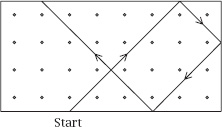
Figure 1.
Dots, mirrors and a path.

Figure 2.
The general array of dots.
• Start a line on a mirror, directly below (above or to the side of) a dot and continue it at 45° until the opposite mirror line is reached.
• Reflect the line through 90° and continue extending the line in this way.
• If the line returns to its beginning before every dot has been enclosed, start a second line near another unenclosed peripheral dot.
• Repeat until all dots have been enclosed.
• Smooth the final figure if desired.
The layout and start of the procedure is shown in
figure 1
.
To analyse the process we adopt the following notation:
f(m,n)
is the number of separate paths needed to enclose all dots of the rectangular array shown in
figure 2
.
It is evident that
f(
1,
n) =
1, and we have seen examples of this in the motifs which are at the start of the Introduction and
chapters 1
and
2
. That
f(m,n) = f(n,m)
is also evident.
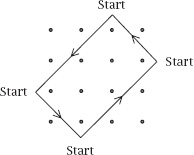
Figure 3.
A complete path in a square array of dots.
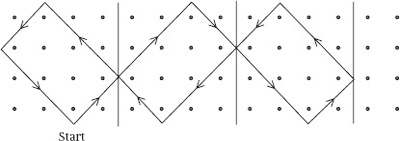
Figure 4.
A path in a rectangular array of dots.
To enable us to recognize the general form of
f(m,n)
we first examine the special case of a square array of size
n × n
. By symmetry the path that starts near a particular dot at a side of the array returns to that side at the same place, as indicated in
figure 3
; this means that, if we have to enclose all dots on a side (and therefore all dots), we need a path for each one of them and this means that
f(n,n) = n
.
Now we look at the general case of an
m×n
array of dots and suppose that
m < n
.
Figure 4
shows such an array, where the vertical lines divide it into
m × m
squares and what rectangle (if any) is left over. Wherever we start the design in the leftmost square, allowing the path to enter the remaining square arrays adds to the design but in no way alters the reflected direction of the path; again, this is shown in
figure 4
. This means that, to count the paths needed to enclose all of the dots, we can remove these square arrays from consideration; notationally, if
we write
n = qm + r
(with
r < m
), then
f(m,n) = f(m,m + r)
and since, by the same reasoning, the first square makes no difference,
f(m,n) = f(m,r)
.

Figure 5.
The 2
×
4 array with an added two-way mirror.
Now let us take two (rather large) numeric examples which utilize these several observations:

and

By now we hope that the reader will have recognized the workings of the Euclidean Algorithm, which is used to find the highest common factor of two integers: in short,

The motifs which appear at the start of the chapters are drawn with lines of various hues where necessary to indicate the number needed in each case to complete the design.
The Reality of the Construction
This may be interesting mathematically but it is of no use to the Chokwe: sona have their primary place in the culture as
figurative representations (as in the motif at the top of this section and in the front matter of the book; the former is styled ‘an antelope’ and the latter ‘an antelope’s footprint’) and also mnemonics for stories or lessons which are important to their folk law. The diagrams are usually created dynamically by the male Chokwe (to be exact, the
akwa kuta sona
or
those who know how to draw
), who trace lines with their fingers in the flat sand, after having formed the dots with the finger tips. As the story unfolds, so the motif is continuously built up as a single curve, the story finishing as the design is completed: it is not permitted to stop and then start another curve, indeed, pausing is frowned upon; the skills are passed from generation to generation during a six- to eight-month period of male initiation rites. If the HCF of the dimensions of the rectangle is not 1, we have seen that the diagram cannot be traced by one continuous movement and this contradicts this essential requirement of the process. Of course, such rectangles could be abandoned but an alternative strategy is to introduce small two-way mirror lines within the array, placed to prevent this happening: this has the added advantage of enhancing the designs further and can be applied whether or not the dimensions are coprime. Look, for example, at
figure 5
, the left part of which shows the 2
×
4 shape which is the basis of the motif from
chapter 5
, to which has been added a small horizontal two-sided mirror. If the path is traced out from the start position, we can see that the mirror line prevents any premature closing up: all of the dots are encircled by one continuous path. The resulting, smoothed pattern is shown on the right.
