X and the City: Modeling Aspects of Urban Life (44 page)
Read X and the City: Modeling Aspects of Urban Life Online
Authors: John A. Adam

where =
=
N
−
c/k
, we see that this has been encountered above; equation (15.11) is just (15.8) with a reduced carrying capacity(we assume that
c
≤
Nk
). The solution (15.9) still applies with this new horizontal asymptote replacing the earlier one. Nevertheless, this reduction is obviously helpful in the relentless fight against foul vermin! In terms of the original capacity
N
, the maximum growth rate is
k
(
N
−
c/k
)
2
/4 and occurs at
x
= (
N
−
c/k
)/2.
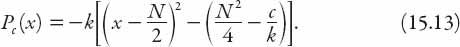
Returning to the constant reduction rate, we now have a governing equation

To study this, we write the quadratic polynomial on the right-hand side of (15.12) as
P
c
(
x
) in the form
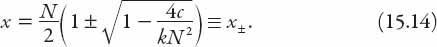
Now
P
c
(
x
) possesses real zeros if and only if
N
2
/4 >
c/k
, that is, if
c
<
kN
2
/4. Then these zeros occur at
Clearly,
P
c
(
x
) > 0 when
x
−
<
x
<
x
+
as opposed to the case for
c
= 0, that is, where
P
0
(
x
) > 0 when 0 <
x
<
N
. Another way of thinking about this is by noticing that the right-hand side of equation (15.12) is just the original quadratic function
kx
(
N
−
x
) “lowered” by the amount
c
. This is illustrated in
Figure 15.2
for
x
in units of
N
(or equivalently,
N
= 1) and
k
= 1,
c
= 0.15.
Recalling that
P
c
(
x
) =
dx/dt
, we can easily see from the figure that for
c
≠ 0 (dotted curve),
dx/dt
< 0 for both
x
<
x
−
and
x
>
x
+
. This means, according to
this simple model, that the population of rats, bedbugs, or whatever it is declines to zero or to
x
+
. Obviously the former is the more desirable of the two situations. Furthermore, if
c
>
kN
2
/4 then
dx
/
dt
for all
x
-values and the vermin population declines continuously to zero. This might reasonably be termed “overkill”!
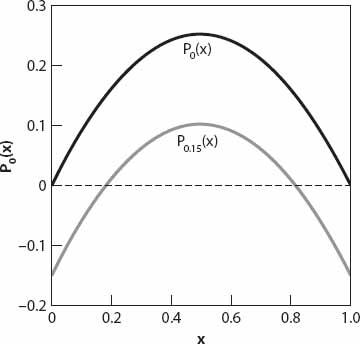
Figure 15.2. Right-hand side of equation (15.12) for
c
= 0 and 0.15 (solid and dotted curves respectively).
Exercise:
Show that the solution of equation (15.12) is given by
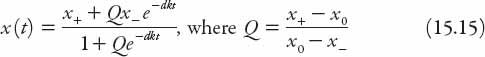
and
d
is the difference of the zeros of
P
c
(
x
), namely,
x
+
−
x
−
. When
c
= 0,
x
+
=
N
, and
x
−
= 0 also verify that result this reduces as it should to the solution (15.9). The graphs of
x
(
t
) in units of
N
are shown in
Figure 15.3
for both
c
= 0 (solid curve) and
c
= 0.15 (dashed curve), with
k
= 1 and
x
0
= 0.25. Each exhibits the classic “logistic curve” sigmoid (or stretched S) shape.
= ∑
N
: HOW MANY PEOPLE HAVE LIVED IN LONDON?
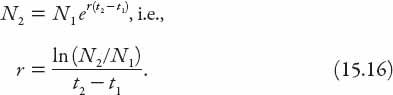
Well, I was one of them, but enough about me. Suppose that at time
t
1
the population was
N
1
, and at a later time
t
2
the population was
N
2
. Assuming that
the growth was exponential, the annual growth rate
r
can then be determined from these data using the equation
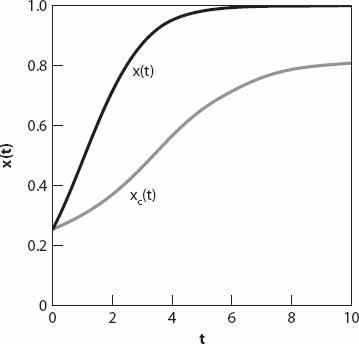
Figure 15.3. Solution curves from equation (15.15) for
c
= 0 and 0.15.
At any time
t
during the interval [
t
1
,
t
2
] the population was
N
1
e
r
(
t
−
t
1
)
and the total number of “person-years” from
t
1
to
t
2
is therefore
