The Spirit Level: Why Greater Equality Makes Societies Stronger (24 page)
Read The Spirit Level: Why Greater Equality Makes Societies Stronger Online
Authors: Richard Wilkinson,Kate Pickett
Tags: #Social Science, #Economics, #General, #Economic Conditions, #Political Science, #Business & Economics

the criminal justice and penal systems have been operating under a huge mistake, namely, the belief that punishment will deter, prevent or inhibit violence, when in fact it is the most powerful stimulant of violence that we have yet discovered.
201
, p. 116
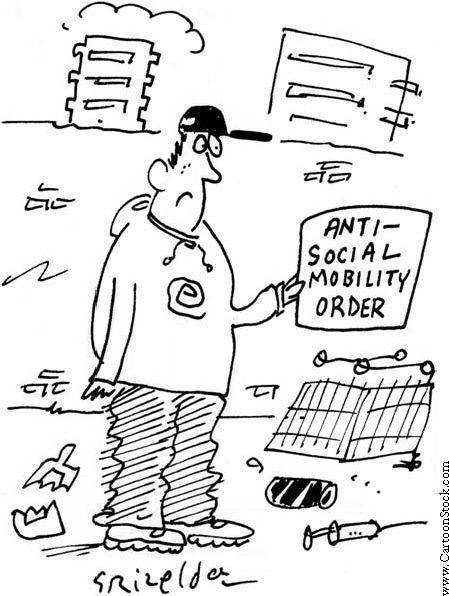
Some efforts to use punishment systems to deter crime are not just ineffective, they actually increase crime. In the UK, the introduction of Anti-Social Behaviour Orders (ASBOs) for delinquent youths has been controversial, partly because they can criminalize behaviour that is otherwise lawful, but also because the acquisition of an ASBO has come to be seen as a rite of passage and badge of honour among some young people.
265
–
266
Although there seems to be a growing consensus among experts that prison doesn’t work, it is difficult to find good, comparable data on re-offending rates in different countries. If a country imprisons a smaller proportion of its citizens, these are more likely to be hardened criminals than those imprisoned under a harsher regime.
So we might expect countries with lower overall rates of imprisonment to have higher rates of re-offending. In fact, there appears to be a trend towards higher rates of re-offending in more punitive systems (in the USA and UK, re-offending rates are generally reported to be between 60 and 65 per cent) and lower rates in less harsh environments (Sweden and Japan are reported to have recidivism rates between 35 and 40 per cent).
HARDENING ATTITUDES
We’ve seen that imprisonment rates are not determined by crime rates so much as by differences in official attitudes towards punishment versus rehabilitation and reform. In societies with greater inequality, where the social distances between people are greater, where attitudes of ‘us and them’ are more entrenched and where lack of trust and fear of crime are rife, public and policy makers alike are more willing to imprison people and adopt punitive attitudes towards the ‘criminal elements’ of society. More unequal societies are harsher, tougher places. And as prison is not particularly effective for either deterrence or rehabilitation, then a society must only be willing to maintain a high rate (and high cost) of imprisonment for reasons unrelated to effectiveness.
Societies that imprison more people also spend less of their wealth on welfare for their citizens. This is true of the US states and also of OECD countries.
267
–
268
Criminologists David Downes and Kirstine Hansen report that this phenomenon of ‘penal expansion and welfare contraction’ has become more pronounced over the past couple of decades. In his book
Crime and Punishment in America
, published in 1998, sociologist Elliott Currie points out that, since 1984, the state of California built only one new college but twenty-one new prisons.
264
In more unequal societies, money is diverted away from positive spending on welfare, education, etc., into the criminal and judicial systems. Among our group of rich countries, there is a significant correlation between income inequality and the number of police and internal security officers per 100,000 people.
212
Sweden employs 181 police per 100,000 people, while Portugal has 450.
Our impression is that, in more equal countries and societies, legal and judicial systems, prosecution procedures and sentencing, as well as penal systems, are developed in consultation with experts – criminologists, lawyers, prison psychiatrists and psychologists, etc., and so reflect both theoretical and evidence-based considerations of what works to deter crime and rehabilitate offenders. In contrast, more unequal countries and states seem to have developed legal frameworks and penal systems in response to media and political pressure, a desire to get tough on crime and be seen to be doing so, rather than on a considered reflection on what works and what doesn’t. John Silverman, writing for the UK’s Economic and Social Research Council, says that prisons are effective only ‘as a means of answering a sustained media battering with an apparent show of force’.
269
In conclusion, Downes and Hanson deserve to be quoted in full:
268
, pp. 4–5
A growing fear of crime and loss of confidence in the criminal justice system among the population, . . . made the general public more favourable towards harsh criminal justice policies. Thus, in certain countries, in particular the United States and to a lesser extent the United Kingdom – public demand for tougher and longer sentences has been met by public policy and election campaigns which have been fought and won on the grounds of the punitiveness of penal policy. In other countries, such as Sweden and Finland, where the government provides greater ‘insulation against emotions generated by moral panic and long-term cycles of tolerance and intolerance’ (Tonry, 1999),
270
citizens have been less likely to call for, and to support, harsher penal policies and the government has resisted the urge to implement such plans.
*
John Irwin writes that while imprisonment is generally believed to have four ‘official’ purposes – retribution for crimes committed, deterrence, incapacitation of dangerous criminals and the rehabilitation of criminals, in fact three other purposes have shaped America’s rates and conditions of imprisonment. These ‘unofficial’ purposes are
class control
– the need to protect honest middle-class citizens from the dangerous criminal underclass;
scapegoating
– diverting attention away from more serious social problems (and here he singles out growing inequalities in wealth and income); and using the threat of the dangerous class for
political gain
.
256
Social mobility: unequal opportunities
All the people like us are We, and every one else is They.
Rudyard Kipling,
We and They
In some historical and modern societies, social mobility has been virtually impossible. Where social status is determined by religious or legal systems, such as the Hindu caste system, the feudal systems of medieval Europe, or slavery, there is little or no opportunity for people to move up or down the social ladder. But in modern market democracies, people can move up or down within their lifetime (
intra-generational
mobility) or offspring can move up and down relative to their parents (
inter-generational
mobility).
The possibility of social mobility is what we mean when we talk about equality of opportunity: the idea that anybody, by their own merits and hard work, can achieve a better social or economic position for themselves and their family. Unlike greater equality itself, equality of opportunity is valued across the political spectrum, at least in theory. Even if they do nothing to actively promote social mobility, very few politicians would take a public stance against equal opportunity. So how mobile are our rich market democracies?
It’s not easy to measure social mobility in societies. Doing so requires longitudinal data – studies that track people over time to see where they started from and where they end up. One convenient way is to take
income mobility
as a measure of social mobility: to see how much people’s incomes change over their lifetimes, or how much they earn in comparison to their parents. To measure inter-generational mobility these longitudinal studies need to cover periods of as much as thirty years, in order for the offspring to establish their position in the income hierarchy. When we have income data for parents and offspring, social mobility can be measured as the correlation between the two. If the correlation between parent’s income and child’s income is high, that means that rich parents tend to have children who are also rich, and poor parents tend to have children who stay poor. When the correlation is low, children’s income is less influenced by whether their parents were rich or poor. (These comparisons are not affected by the fact that average incomes are now higher than they used to be.)

LIKE FATHER, LIKE SON?
Comparable international data on inter-generational social mobility are available for only a few of our rich countries. We take our figures from a study by economist Jo Blanden and colleagues at the London School of Economics.
271
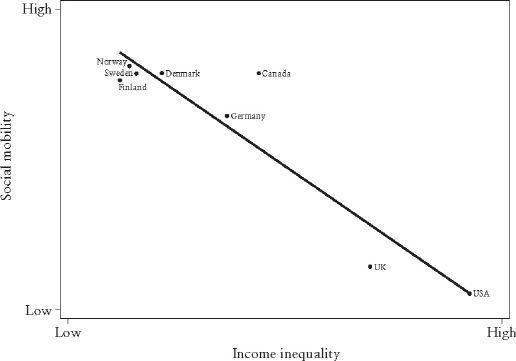
Using large, representative longitudinal studies for eight countries, these researchers were able to calculate social mobility as the correlation between fathers’ incomes when their sons were born and sons’ incomes at age thirty. Despite having data for only eight countries, the relationship between intergenerational social mobility and income inequality is very strong. Figure 12.1 shows that countries with bigger income differences tend to have much lower social mobility. In fact, far from enabling the ideology of the American Dream, the USA has the lowest mobility rate among these eight countries. The UK also has low social mobility, West Germany comes in the middle, and Canada and the Scandinavian countries have much higher mobility.
With data for so few countries we need to be cautious, particularly as there are no data of this sort that allow us to estimate social mobility for each state and test the relationship with inequality independently in the USA. But other observations, looking at changes in social mobility over time, public spending on education, changes in geographical segregation, the work of sociologists on matters of taste and psychologists on displaced aggression, and so-called group density effects on health, lend plausibility to the picture we see in Figure 12.1.

Figure 12.1
Social mobility is lower in more unequal countries.
149
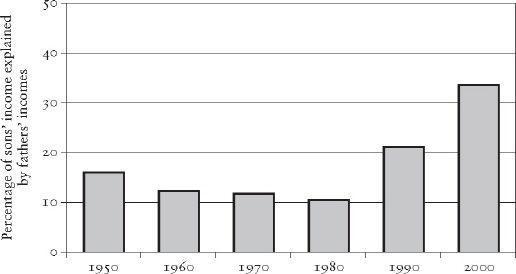
The first of these observations is that, after slowly increasing from 1950 to 1980, social mobility in the USA declined rapidly, as income differences widened dramatically in the later part of the century.
Figure 12.2 uses data from
The State of Working America 2006/7
report. The height of each column shows the power of fathers’ income to determine the income of their sons, so
shorter
bars indicate more social mobility: fathers’ incomes are less predictive of sons’ incomes. Higher bars indicate less mobility: rich fathers are more likely to have rich sons and poor fathers to have poor sons.
Data from the 1980s and 1990s show that about 36 per cent of children whose parents were in the bottom fifth of the wealth distribution end up in that same bottom fifth themselves as adults, and among children whose parents were in the top fifth for wealth, 36 per cent of them can be found in the same top fifth.
272
Those at the top can maintain their wealth and status, those at the bottom find it difficult to climb up the income ladder, but there is more flexibility in the middle. Inter-generational social mobility has also been falling in Britain over the time period that income differences have widened.
271

