Red Capitalism (9 page)
Authors: Carl Walter,Fraser Howie
Tags: #Business & Economics, #Finance, #General

Source: Wind Information
To arrive at the ICBC’s market-cap figure, Bloomberg analysts added the value of the bank’s Hong Kong-listed shares to that of all the domestic shares. But the domestic shares include A-shares trading on the market in Shanghai and the formerly non-tradable, now locked up, shares held by government agencies. These latter shares are valued at the full tradable A-share price. What would be the value of an ICBC A-share if the government decided to sell even a small part of its 70 percent holdings? The answer has already been provided by the market reaction in June 2001 to the CSRC’s plans to do just that: prices collapsed.
5
This share structure and the company valuation problem is the same for all other Chinese banks and companies. There is no good way to arrive at a market-cap figure that is comparable to listed companies in developed markets and private economies.
To illustrate this point further, take the following simplistic calculation: use 30 percent, the amount of its tradable market float, of ICBC’s market-cap figure of US$201 billion, or US$60 billion, as a rough proxy for the bank’s market value. This approach gives consideration to the dilution effect of the current 70 percent of the bank’s shares as if they were available to trade. Despite its crudeness, this result is no less inaccurate than any other. Whatever the number, this serves to highlight the fact that China’s banks are worth somewhat less than the number the Bloomberg researchers calculate.
Markets are not simply a valuation mechanism. International stock exchanges are called markets because companies can be bought and sold on them. In China and Hong Kong, given absolute majority government control, shares trade, but companies do not. Major merger and acquisition (M&A) transactions do not take place through the exchanges; they are the result of government amalgamations of state assets at artificial prices. Would that it were possible to gain a controlling interest in a listed Chinese bank or securities company simply by acquiring its listed shares and making a public tender!
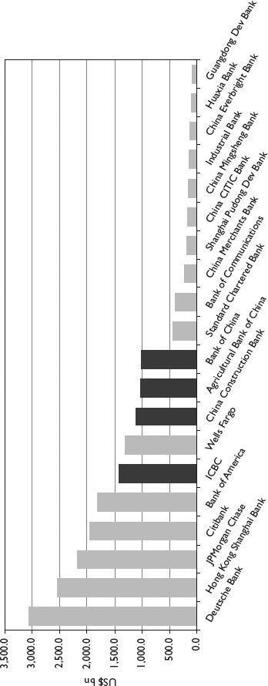
One way to make a straightforward comparison between US and Chinese banks is based on their total assets. The fact that many international banks are larger than even the largest Chinese banks is not unreasonable given that the respective GDPs of many developed economies are many times that of China. But as the data in
Figure 2.5
illustrate, the Big 4 banks are in the same league as many of their international peers and they tower over Chinese second-tier banks. Asset size gives an idea of significance to the economy but, taken alone, is not a good measure of the strength of these banks; asset quality is.
FIGURE 2.5
Selected international and Chinese banks by total assets, FY2008

Source:The Banker and respective annual reports
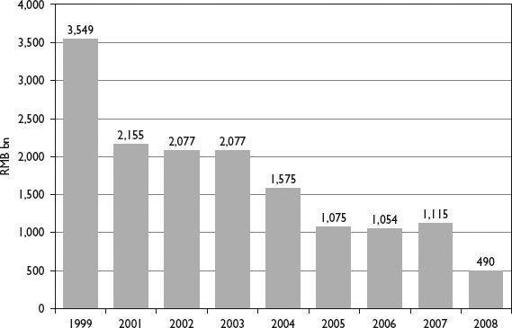
This gets to the true heart of the issue. Understanding how the Chinese banks were relieved of their problem-loan burdens leads to a clear understanding of their continuing weakness. The data in
Figure 2.6
show an impressive and factual reduction in total non-performing commercial bank loans over the seven years through 2008. In 1999, the NPL ratio (simply put, bad loans divided by total loans) of the Big 4 banks was a massive 39 percent just before spinning off the first batch of bad loans totaling US$170 billion in 2000. From 2001 to 2005 ICBC, CCB, and BOC spun off or wrote off a further US$200 billion. In 2007, ABC, the last of the major banks to restructure, spun off another US$112 billion, making a total among the four banks of around US$480 billion.
FIGURE 2.6
Non-performing loan trends in the top 17 Chinese banks, 1999–2008

Source: PBOC, Financial Stability Report, various; Li Liming, p. 185
It is thought that the bulk of these bad loans originated in the late 1980s and early 1990s when bank lending flew out of control, as it did in 2009. If that is the case, this nearly US$480 billion in bad loans was equivalent to about 20 percent of China’s GDP for the five-year period from 1988 to 1993, the year Zhu Rongji applied the brakes. A more important point, perhaps, is that the banks silently carried these NPLs for a further five years before anything was about them and another 10 years went by before they were said to be fully worked out (but not written off).
The US savings-and-loan crisis of the 1980s may help put China’s NPL experience into some perspective. The Federal Deposit Insurance Corporation (FDIC) has calculated that during the 1986–1999 period in the US, the combined closure of 1,043 thrift institutions holding US$519 billion in assets resulted in a net loss after recoveries to taxpayers and the thrift industry of US$153 billion at the end of the clean-up in 1999.
6
In other words, the recovery rate achieved was over 60 percent. In contrast, the commonly noted rate in China after 10 years of NPL-workout efforts is considered to be around 20 percent.
This vast difference in recovery rates on comparable amounts, together with the dramatic decrease in NPLs shown in Figure2.6, raises a host of questions. If, in fact, the NPL rates of Chinese banks have now improved to such a degree, is it because they are lending to better companies that have the capacity as well as the willingness to repay, or did their original SOE clients simply start to pay again? If the latter is the case, why were the previous problem-loan recovery rates so low? A significant change in client base can be ruled out: Chinese banks overwhelmingly lend to SOEs and always have, largely because they are viewed as reliable, unlike private companies. In retrospect, this attitude seems to be mistaken.
The Party tells the banks to loan to the SOEs, but it seems unable to tell the SOEs to
repay the loans.
This gets at the nub of the issue: the Party
wants
the banks to support the SOEs in all circumstances. If the SOEs fail to repay, the Party won’t blame bank management for losing money; it will only blame bankers for not doing what they are told. Simply reforming the banks cannot change SOE behavior or that of the Party itself. Improved NPL ratios over the past 10 years, therefore, suggest a dramatic improvement in the willingness of SOE clients to meet their loan commitments, the selection of investment projects that actually generate real cash flow, or some other arrangement for bad loans.
THE SUDDEN THIRST FOR CAPITAL AND CASH DIVIDENDS, 2010
If it is true that lending standards have improved significantly, perhaps there is no need to be concerned about the after-effects of the 2009 lending binge; the quality of Chinese bank balance sheets will remain sound and the level of write-offs manageable. The frantic scrambling for more capital from early in 2010, however, suggests otherwise. The CEO of ICBC, Yang Kaisheng, has written a uniquely direct article analyzing the challenges facing China’s banks.
7
In it, he describes China’s financial system:
In our country’s current level of economic development, we must maintain a level of macroeconomic growth of around eight percent per annum and this will inevitably require a corresponding level of capital investment. Our country’s financial system is primarily characterized by indirect financing (via banks); the scale of direct financing (via capital markets) is limited.
This statement of fact says two important things about China’s banking system. First, there is an overall economic goal of eight percent growth per year that requires “capital investment.” Second, the source of capital in China relies mainly on the banks. In other words, bank lending is the only way to achieve eight percent GDP growth.
With estimates of loan growth, profitability and dividend payout ratios, Yang then states that the Big 3 banks plus the Bank of Communications will, over the next five years, need RMB480 billion (US$70 billion) in new capital.
8
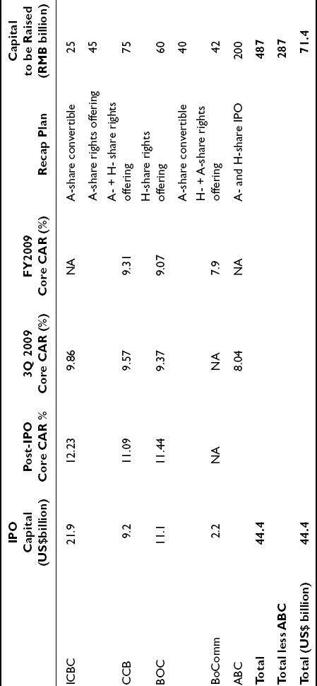
Yang is saying “raised over five years,” but these banks are trying to raise this amount in just one year, 2010. Putting aside ABC’s proposed US$29 billion IPO goal, by April 2010, the other banks had already announced plans to raise RMB287 billion (US$42.1 billion), as shown in
Table 2.3
.
TABLE 2.3
Reported capital-raising plans by the Big 5 banks, May 2010
Source: Annual and interim bank reports, Bloomberg; industry estimates as of May 2010

This is an astounding amount, coming as it does only four to five years after their huge IPOs in 2005 and 2006 had raised a total of US$44.4 billion. Yang goes on to say that if market risk, operating risk, and increasingly stringent definitions of capital requirements are considered, then the capital required will be even greater. What he doesn’t mention, though, is the risk of bad loans. It would seem that Yang’s point in citing these facts is that China’s current Party-led banking arrangements do not work, in spite of the picture presented to the outside world. It is a defense of the model put forward by Zhu Rongji in 1998.
The experience of the past 30 years shows that China’s banks and their business model is extremely capital-intensive. The banks boomed and went bust with regularity at the end of the 1970s, 1980s and 1990s. Now another decade has gone by and the banks have run out of capital again. Even though they appear healthy and have each announced record profits and low problem-loan ratios for 2009, the Tier 1 capital ratios of the Big 3 are rapidly approaching nine percent, down from a strong 11 percent just after their IPOs in 2005 and 2006. Of course, the lending spree of 2009 was the proximate cause. As an analyst at a prominent international bank commented: “The growth model of China banks requires them to come to the capital markets every few years. There’s no way out and this will be a long-term overhang on the market.”
9
But it is not just the lending of 2009 or even their business model that drives their unending thirst for capital; it is also their dividend policies.
The data in
Figure 2.7
show actual cash dividends paid out by the Big 3 banks over the period 2004–2008, during which each was incorporated and then listed in Hong Kong and Shanghai. The figure also shows the funds raised by these banks from domestic and international equity investors in their IPOs. The money paid out in dividends, equivalent to US$42 billion,
matches exactly
the money raised in the markets. What does this mean? It means international and domestic investors put cash into the listed Chinese banks simply to pre-fund the dividends paid out by the banks largely to the MOF and Central SAFE Investment. These dividends represented a transfer of real third-party cash from the banks directly to the state’s coffers. Why wouldn’t international investors keep the cash in the first place?
