Red Capitalism (4 page)
Authors: Carl Walter,Fraser Howie
Tags: #Business & Economics, #Finance, #General

To symbolize this transformation, the government planned a new target. After China Mobile’s successful IPO, Beijing sought as a matter of policy to place as many Chinese companies on the
Fortune
Global 500 list as possible. With the willing help of international investment banks, lawyers, and accounting firms, China has more than achieved this goal. The country is now proudly represented by 44 companies on the list (see
Table 1.2
). Among these companies are five banks, including ICBC, which ranked eighty-seventh by total revenues (as compared to twenty-fifth for JPMorgan Chase). Sinopec and the huge State Grid Corporation ranked seventh and eighth, respectively. The “National Team” was born.
TABLE 1.2
Chinese companies in the
Fortune
Global 500, FY2009
Source: Fortune, July 26, 2010
| Rank | Company | Revenues (US$ million) |
| 7 | Sinopec | 187,518 |
| 8 | State Grid | 184,496 |
| 10 | China National Petroleum | 165,496 |
| 77 | China Mobile Communications | 71,749 |
| 87 | Industrial & Commercial Bank of China | 69,295 |
| 116 | China Construction Bank | 58,361 |
| 118 | China Life Insurance | 57,019 |
| 133 | China Railway Construction | 52,044 |
| 137 | China Railway Group | 50,704 |
| 141 | Agricultural Bank of China | 49,742 |
| 143 | Bank of China | 49,682 |
| 156 | China Southern Power Grid | 45,735 |
| 182 | Dongfeng Motors | 39,402 |
| 187 | China State Construction Engineering | 38,117 |
| 203 | Sinochem Group | 35,577 |
| 204 | China Telecommunications | 35,557 |
| 223 | Shanghai Automotive | 33,629 |
| 224 | China Communications Construction | 33,465 |
| 242 | Noble Group | 31,183 |
| 252 | China National Offshore Oil | 30,680 |
| 254 | CITIC Group | 30,605 |
| 258 | China FAW Group | 30,237 |
| 275 | China South Industries Group | 28,757 |
| 276 | Baosteel Group | 28,591 |
| 312 | COFCO | 26,098 |
| 313 | China Huaneng Group | 26,019 |
| 314 | Hebei Iron & Steel Group | 25,924 |
| 315 | China Metallurgical Group | 25,868 |
| 330 | Aviation Industry Corporation of China | 25,189 |
| 332 | China Minmetals | 24,956 |
| 348 | China North Industries Group | 24,150 |
| 352 | Sinosteel | 24,014 |
| 356 | Shenhua Group | 23,605 |
| 368 | China United Network Communications | 23,183 |
| 371 | People’s Insurance Company of China | 23,116 |
| 383 | Ping An Insurance | 22,374 |
| 395 | China Resources | 21,902 |
| 397 | Huawei Technologies | 21,821 |
| 412 | China Datang Group | 21,460 |
| 415 | Jiangsu Shagang Group | 21,419 |
| 428 | Wuhan Iron & Steel | 20,543 |
| 436 | Aluminum Corporation of China | 19,851 |
| 440 | Bank of Communications | 19,568 |
| 477 | China Guodian | 17,871 |
At the start of the 1990s, all Chinese companies had been unformed state-owned enterprises; by the end of the decade, hundreds were listed companies on the Hong Kong, New York, London and Shanghai stock exchanges. In those few short years, bankers, lawyers and accountants had restructured those of the old SOEs that could be restructured into something resembling modern corporations, then sold and listed their shares. In short, China’s
Fortune
Global 500 companies were the products of Wall Street; even China’s own locally listed version of investment banking, represented by CITIC Securities with a market capitalization of US$26 billion, was built after the American investment-banking model.
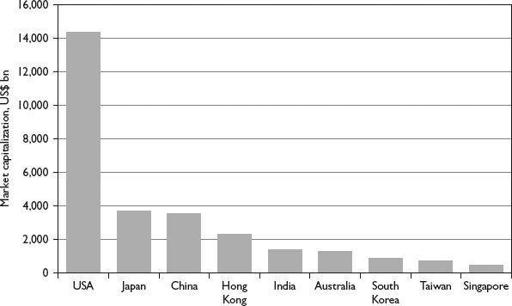
China’s capital markets, including Hong Kong, are now home to the largest IPOs and are the envy of investment bankers and issuers the world over. With a total market capitalization of RMB24.5 trillion (US$3.6 trillion) and more than 1,800 listed companies, the Shanghai and Shenzhen exchanges have, in the last 10 years, come to rival all exchanges in Asia, including the Tokyo Exchange (see
Figure 1.5
). If the Hong Kong Stock Exchange is considered Chinese—and it should be, since Chinese companies constitute 48.1 percent
2
of its market capitalization—then China over the past 15 years has given rise to the second-largest equity-capital market in the world after New York. From 1993, when IPOs began, to early 2010, Chinese SOEs have raised US$389 billion on domestic exchanges and a further US$262 billion on international markets, adding a total of US$651 billion in capital to the US$818 billion contributed by foreign direct investment. Considering that China’s GDP in 1985 was US$306 billion, only US$971 billion in 1999 and US$4.9 trillion in 2009, this was big money.
FIGURE 1.5
Comparative market capitalizations, China, the rest of Asia, and the US

Source: Bloomberg, March 26, 2010
While money is money, there is a difference in the impact these two sources of capital have had on China. FDI created an entirely new economy; the non-state sector. Over the years, the management and production skills, as well as the technologies of foreign-invested companies have been transferred to Chinese entrepreneurs and have given rise to new domestic industries. In contrast, the larger part of the US$651 billion raised on international and domestic capital markets has gone to creating and strengthening companies “inside the system.” Beijing had, from the very start in 1993, restricted the privilege of listing shares to state-owned enterprises in the name of SOE reform. The market capitalization in Hong Kong, Shanghai and elsewhere belongs to companies controlled outright by China’s Communist Party; only minority stakes have been sold.
All of these—SOE and bank reform, stock markets, international IPOs and, most of all, accession to the WTO—might be described as the core initiatives of the Jiang Zemin/Zhu Rongji program for the transformation of that part of China’s economy “inside the system.” From 2003 and the accession of the new Party leadership under Hu Jintao and Wen Jiabao, this program began to drift and even came under attack for having created “intolerable” income disparities. The drift ended in 2005 when forward progress on financial reform largely came to a halt long before the collapse of Lehman Brothers in September 2008 killed it stone dead.
3
THE END OF REFORM: 2005
The year 2005 is fundamental to understanding China’s financial markets today—it marks the last great thrust of the Jiang/Zhu era. What remains in place continues to be very visible, providing China with the sheen of modern markets and successful reform. The stock, commodity and bond markets help support Beijing’s claim to be a “market economy” under the terms of the WTO. But the failure to complete the reforms begun in 1998 has left China’s financial institutions, especially its banks, in a vulnerable position. As the Fourth Generation Leadership took over in early 2003, there were two major initiatives underway. The first was the bank-restructuring program that had begun in 1998 and was just starting on a second round of disposals of problem loans. The second was the ongoing effort to restore a collapsed stock market to health. Zhou Xiaochuan, who had moved from being chairman of the CSRC to governor of the central bank in 2002, was Zhu Rongji’s principal architect.
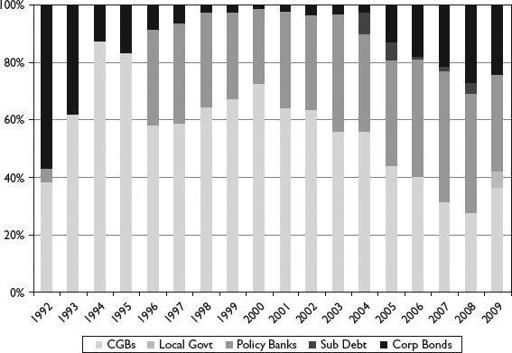
Zhou had necessarily started with the banks since their fragile state in 1998 was a threat to the entire economy. Given China’s underdeveloped capital markets, nearly all financial risk was then concentrated in the banks. To create a mechanism to alleviate this stress, Zhou sought to develop a bond market. Such a market would allow corporations to establish direct financial links with end-investors and would also mean greater financial flexibility at times when stock markets were weak or unattractive. At this point in 2003, corporate debt constituted less than 3.5 percent of total issuance in China’s bond market (see
Figure 1.6
).
FIGURE 1.6
Bond market issuance by issuer type, 1992–2009

Source: PBOC Financial Stability Report, various
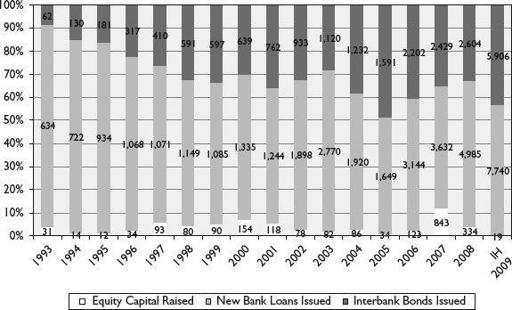
The market itself provided less than 30 percent of all capital raised, including loans, bonds and equity (see
Figure 1.7
).
FIGURE 1.7
Corporate capital raised in Chinese markets, 1993–1H 2009

