X and the City: Modeling Aspects of Urban Life (32 page)
Read X and the City: Modeling Aspects of Urban Life Online
Authors: John A. Adam

According to one source,
T
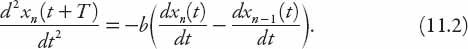
is approximately 1.5 seconds for half of all drivers, and in the range 1–2.2 sec for all drivers, though over two seconds seems rather high to me. Equation (11.2) is actually a system of
delay-differential
equations (
n
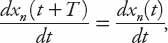
= 1, 2, 3, . . .) and in general these are notoriously difficult to solve. It can be integrated directly however, to yield

where
c
n
is a constant of integration. This equation defines the speed of the
n
th car in terms of the separation from the car in front at an earlier time. Let’s examine the special case of a
steady state
(or time-independent) situation in which all the cars are spaced equidistantly, and hence moving at the same speed. Then, since
equation (11.3) may be reformulated as

We may now ask how the spacing
x
n
(
t
) −
x
n
−1
(
t
) = −
d
might depend on the traffic concentration
k
. In the situation described by equation (11.4), consider all vehicles to have length
l
, so that the number of cars per mile (or km) will be the constant value
k
= (
l
+
d
)
−1
. From equation (11.4) with
c
n
=
c
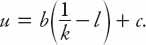
Imposing the reasonable requirement that at the maximum possible density
k
max
(bumper-to-bumper traffic),
u
= 0, we can solve for the constant
c
to obtain the simple result
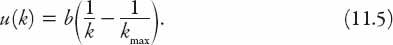
There is a problem, however; this equation predicts that
u
→ ∞ as
k
→ 0(!). But it is easily resolved, because we know that for small enough densities, 0 <
k
<
k
c
say,
u
≈
u
max
. By requiring
u
(
k
) to be continuous it is necessary to choose
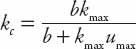
so that the traffic flow is
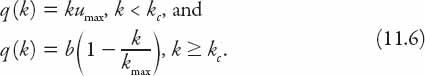
A typical
q-k
graph is shown in
Figure 11.1
. It is a piecewise linear approximation to the concave-down curve discussed in the previous model. One unfortunate feature is that the maximum flow occurs at
k
=
k
c
, which is unlikely to be the case. The corresponding
u-k
graph is shown as a dotted line.
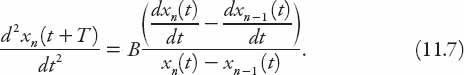
The above model is rather limited in its scope, and can be improved somewhat by modifying the proportionality parameter
b
. This is likely to depend on the distance between the car and the one it is following; it seems reasonable to conclude that the closer it follows, the larger will be the accelerative or decelerative response. This quantity is in effect a sensitivity term. To this end, we choose
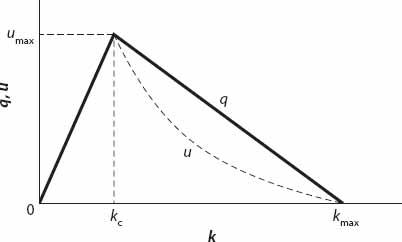
Figure 11.1.
q
(
k
) and
u
(
k
) profiles based on equations (11.6) and (11.5), respectively.
so that instead of the linear equation (11.2) we have the following nonlinear version: