Read X and the City: Modeling Aspects of Urban Life Online
Authors: John A. Adam
X and the City: Modeling Aspects of Urban Life (27 page)

=
N
(
W
): GAPS AT SCHOOL CROSSINGS
Similar principles apply here, though a little preliminary work is necessary. What is the average walking speed of a school-aged child? Let’s take the arithmetic mean of 1 mph (for the very young, or dawdlers!) and 3 mph for older children. Now

by the way; a result used in
Chapter 6
. If the width of the street in feet is
W
, then the time to cross the street is
t
c
=
W
/3 seconds. Of course, school crossings generally have guards who halt the traffic when the build-up of waiting children is sufficiently large. We shall dispense with the guards here and rely on natural gaps in the traffic to permit an opportunity to cross, say on average once every minute. We’ll assume that the traffic flow past the crossing is governed by a distribution with a flow rate of
N
vehicles per hour. We wish to find the maximum flow rate,
N
max
, which would permit the above crossing opportunity. If
N
>
N
max
then we’ll reinstate the crossing guards!
The expected (or average) number of vehicles in the crossing
t
c
is
Nt
c
/3600, so as above, the probability that no vehicle will pass in that interval is
For
k
successive intervals of this length, on average
kP
of these will have no vehicular traffic, and for there to be one of these,
k
=
P
−1
. These
k
intervals correspond to a time . Therefore
and so
that is, if = 60
= 60
s
(corresponding to at least one crossing opportunity per minute),

A graph of this function is shown in
Figure 9.1
, drawn for a minimum width
W
= 20 ft. Notice how rapidly the maximum permissible flow rate decreases with the width of the street, particularly in the 20–40 ft range. It makes much sense then, for crossing guards to be in place especially in the vicinity of schools located near large highways.
We return to the question: how might the vehicles be distributed (in time) along the roadway? One possibility is the above-mentioned Poisson distribution (
Chapter 3
; see also
Appendix 4
), from which the probability of
n
arrivals in unit time is
Another possible model is the second one described above: the displaced exponential distribution with density function

From this, the probability of encountering a gap exceeding a given time interval
T
is
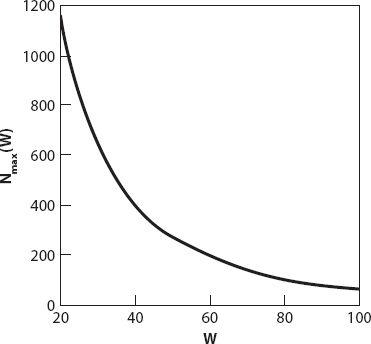
Figure 9.1. Maximum flow rate vs. width of road.

The constant
a
is the minimum time gap (≈ 1 second for example). For a traffic flow rate of 600 vehicles per hour we can take
λ
= 1/6 vehicle/second. Suppose that a (fairly nimble) pedestrian requires a gap of at least
T
= 6 seconds to successfully cross the road; then with
a
= 1 the corresponding probability of being able to do so is
e
−5/6
≈ 0.43. Note also that
