Windows Server 2008 R2 Unleashed (269 page)
Read Windows Server 2008 R2 Unleashed Online
Authors: Noel Morimoto

select Add Counters.
NOTE
Typical baseline counters consist of Memory - Pages/Sec, PhysicalDisk - Avg. Disk
Queue Length, and Processor - % Processor Time.
Performance and Reliability Monitoring
1363
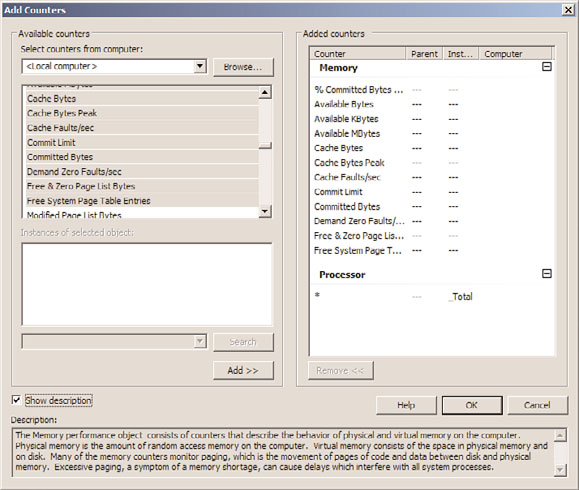
3. The Add Counters dialog box is invoked, as shown in Figure 33.8. In the Available
Counters section, select the desired counters, and click the Add button.
33
ptg
FIGURE 33.8
Adding counters to Performance Monitor.
NOTE
Windows Server 2008 R2 includes a tremendous amount of counters to choose from
when conducting performance monitoring. It is challenging to fully explain what each
counter offers in this section. If you are interested in finding out more about a counter,
enable the Show Description option in the Add Counters dialog box and highlight a spe-
cific counter to obtain a detailed explanation of it.
4. Review the selected counters in the Added Counters section, and then click OK.
NOTE
When adding counters, it is possible to conduct remote monitoring by selecting coun-
ters from another system. To simplify things, it is also possible to search for instances
of a counter and add a group of counters.
Managing Performance Monitor Settings
While back on the Performance Monitor display, update displays by clicking the Clear
Display button. Clicking the Freeze Display button or pressing Ctrl+F freezes displays,
1364
CHAPTER 33
Logging and Debugging
which suspends data collection. Data collection can be resumed by pressing Ctrl+F or
clicking the Freeze Display button again. Click the Update Data button to display an
updated data analysis.
It is also possible to export and import a display by using the Cut and Paste buttons. For
example, a display can be saved to the Clipboard and then imported into another instance
of Performance Monitor. This is commonly used to view or analyze system information on
a different system, such as information from a production server.
The Properties page of Performance Monitor has five additional tabs of configuration:
General, Source, Data, Graph, and Appearance. Generally, the Properties page provides
access to settings that control the graph grid, color, style of display data, and so on. Data
can be saved from the monitor in different ways. The easiest way to retain the display
features is to save the control as an HTML file.
Performance Monitor enables you to also save log files in HTML or tab-separated (.tsv)
format, which you can then analyze by using third-party tools. Alternatively, a tab-sepa-
rated file can be imported into a spreadsheet or database application such as Excel or
Microsoft Access. Windows Server 2008 R2 also enables you to collect data in SQL data-
base format. This is useful for performance analysis at an enterprise level rather than a
per-server basis. Reports displayed in Excel can help you better understand the data as well
as provide reports to management. As well as saving log files, you can save the results
ptg
from Performance Monitor as an image. This is great when you need to obtain a point-in-
time depiction of a performance graph.
Data Collector Sets
The Data Collector Sets is a vital new feature available as a subfolder within the
Performance Monitor snap-in. The purpose of a Data Collector Set is to review or log
system performance data. This is achievable through a single component that encom-
passes organized multiple data collection points. This information can then be analyzed to
diagnose problems, correct system performance issues, or create baselines.
Performance counters, event trace data, and system configuration information are all data
collector elements that can be captured and contained in a Data Collector Set. Data
Collector Sets can be based on a predefined template, from a Data Collector Set that
already exists, by creating it manually, with a wizard, or it can be user defined. Data
Collector Sets can be exported and used for multiple systems, easing the administrative
load involving the configuration of new systems producing more effective monitoring.
Wizards facilitate the creation of Data Collector Sets and enable an administrator to
quickly create collections based on server roles or the type of information that is required.
NOTE
To create Data Collector Sets, you must be a member of the Administrators group or
logged on with an account that is a member of the Performance Log Users group.
Performance and Reliability Monitoring
1365
Creating Data Collector Sets
Data Collector Sets can be created manually from a template or from Performance
Monitor. The following examples will help you to gain an understanding of the different
methods for creating Data Collector Sets.
To create a Data Collector Set from Performance Monitor, do the following:
1. In the Performance Monitor snap-in, navigate to Performance Monitor.
2. Add counters based on items you want to capture. For this example, the following
counters were used: Memory - Pages/Sec, Physical Disk - Avg.Disk Queue Length, and
33
Processor - % Processor Time.
3. After the counters are added, right-click on Performance Monitor in the navigation
tree, select New, and then select Data Collector Set. The Create New Data Collector
Set Wizard is launched.
4. Enter a name for this new Data Collector Set on the Create New Data Collector Set
page, and then click Next.
5. On the next page, specify where you want the data to be saved. The default path is
the %systemdrive%\PerfLogs\. Click Finish to save the current settings and exit or
click Next to enter a user account to run as.
6.
ptg
Click the Change button to enter a user for this data set.
7. Select the option to Save and Close or Start This Data Collector Set Now, and then
click Finish to complete the Data Collector Set creation process.
The resulting Data Collector Set can be configured to run immediately by right-clicking
the new Data Collector Set and selecting Start. The properties of the Data Collector Set can
be viewed by right-clicking and selecting Properties.
Data Collector Sets can be created, saved, or restored from templates. Many templates are
built in and can be created using the Create New Data Collector Set Wizard in Windows
Performance Monitor. This wizard is invoked by right-clicking on the User Defined folder,
the Event Trace Sessions folder, or the Startup Event Trace Sessions folder under Data
Collector Sets and selecting New, Data Collector Set.
To create a Data Collector Set from a template, do the following:
1. Expand the Data Collector Sets folder and then the User Defined subfolder in the
Performance Monitor snap-in.
2. Right-click the User Defined subfolder and select New Data Collector Set to launch
the Create New Data Collector Set Wizard.
3. Enter a name for this new Data Collector Set, select the Create from a Template
option, and then click Next.
4. On the next page, select the desired template to use, and then click Next.
1366
CHAPTER 33
Logging and Debugging
NOTE
The Create New Data Collector Set Wizard offers three templates for creating Data
Collector Sets. The templates include Basic, System Diagnostics, and System
Performance. Use the Basic template when there is a need to create a basic Data
Collector Set. The System Diagnostics template generates a report detailing the status
of local hardware resources, system response times, system information, and configu-
ration data. The Systems Performance template is leveraged when you want to not only
generate a report detailing the status of local hardware resources and system
response times, but also processes on the local computers. In summary, typically the
Basic template provides basic diagnostics, whereas the Systems Diagnostics template
is good for maximizing performance and streamlining system operations, and the
System Performance template is a good choice when you want to identify performance
issues. Each of the templates can be edited after they have been created. In addition,
it is possible to select the Browse button and import templates from other servers.
5. On the next page, specify where you want the data to be saved. The default path is
the %systemdrive%\PerfLogs\. Click Finish to save the current settings and exit or
click Next to enter a user account to run as.
ptg
6. Click the Change button to enter a user for this data set.
7. Select the option to Save and Close, Start This Data Collector Set Now, or Open
Properties for This Data Collector Set, and then click Finish to complete the Data
Collector Set creation process.
Reports
The final folder in the Performance Monitor snap-in is Reports. The Reports folder
provides diagnostic reports to support administrators in troubleshooting and diagnosing
system performance problems including reliability. Reports are viewed in the central
details pane of the Performance Monitor snap-in.
The reports are based on Data Collector Sets that were previously defined by users or
preconfigured and included with Windows Server 2008 R2 Performance Monitor. The
report console’s features and functionality are very similar to those seen by means of the
reports introduced with Server Performance Advisor in Windows Server 2003.
The Reports folder is broken into two main subfolders: User Defined reports and System
reports. The default System reports typically include reports relating to LAN Diagnostics,
System Diagnostics, and System Performance. Additional System reports are automatically
generated depending on the server role installed on the Windows Server 2008 R2 system.
For example, an Active Directory Diagnostics system report is automatically included in
the console when the Active Directory Domain Services server role is installed on the
Windows Server 2008 R2 system.
Creating a User Defined Report
The first step in creating a User Defined report is creating a User Defined Collector Set and
defining the parameters for a collection. After the User Defined Collector Set is created,
Performance and Reliability Monitoring
1367
data collection must be manually started or scheduled to run at a specific date. At this
time, a report folder is automatically generated under the User Defined folder. After the
report is created, you can review the contents by selecting it. When viewing reports, it is
possible to expand specific items such as the report summary, diagnostic results, or CPU
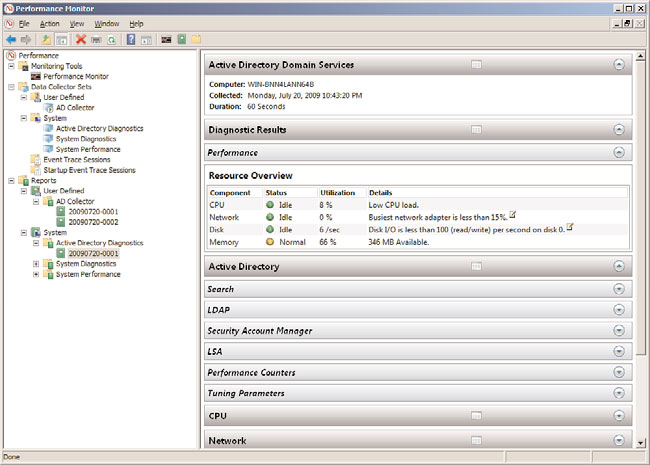
for additional information. This is depicted in the sample System Performance Report in
Figure 33.9.
33
ptg
FIGURE 33.9
Viewing the System Performance Report.
Viewing Predefined System Reports
Another option for assessing system health and troubleshooting system anomalies is to
leverage the predefined system reports. The following steps illustrate how to view these
system reports:
1. In the Performance Monitor navigation tree, expand the Data Collector Sets folder
and then System.
2. Right-click one of the predefined Data Collector Sets such as System Diagnostics, and
then click Start. This starts the data collection process.
3. Now expand the Reports folder, System, and then System Diagnostics.
4. Highlight the newly created report and review the contents of the report in the cen-