Windows Server 2008 R2 Unleashed (266 page)
Read Windows Server 2008 R2 Unleashed Online
Authors: Noel Morimoto

1348
CHAPTER 33
Logging and Debugging
Monitoring Performance
The Performance tab enables you to view the CPU and physical memory usage in graphi-
cal form. This information is especially useful when you need a quick view of a CPU or
memory performance bottleneck.
The Performance tab makes it possible to graph a percentage of processor time in Kernel
mode. To show this, select View, Show Kernel Times. The kernel time is represented by the
red line in the graph. The kernel time is the measure of time that applications are using
operating system services. The other processor time is known as User mode. User mode
processor time is spent in threads that are spawned by applications on the system.
If your server has multiple CPU processors installed, you can view multiple CPU graphs at
a time by selecting View, CPU History and choosing either One Graph Per CPU or One
Graph, All CPUs.
Also on the Performance tab, you will find a button labeled Resource Monitor. You can
invoke Resource Monitor for additional analysis of the system.
Monitoring Network Performance
The Networking tab provides a measurement of the network traffic for each adapter on
the local server in graphical form, as shown in Figure 33.2.
ptg
FIGURE 33.2
The Networking tab in the Windows Task Manager.
For multiple network adapters—whether they are dial-up, a local area network (LAN)
connection, a wide area network (WAN) connection, a virtual private network (VPN)
Using the Task Manager for Logging and Debugging
1349
connection, or the like—the Networking tab displays a graphical comparison of the traffic
for each connection. It provides a quick overview of the adapter, network utilization, link
speed, and state of your connection.
To show a visible line on the graph for network traffic on any interface, the view automat-
ically scales to magnify the view of traffic versus available bandwidth. The graph scales
from 0% to 100% if the Auto Scale option is not enabled. The greater the percentage
shown on the graph, the less is the magnified view of the current traffic. To auto scale and
capture network traffic, select Options, Auto Scale.
It is possible to break down traffic on the graph into Bytes Sent, Received, and Total Bytes
33
by selecting View, Network Adapter History and checking the selections you want
graphed. This can be useful if you determine the overall throughput is high and you need
to quickly determine if inbound or outbound traffic is an issue. In this situation, the
default setting is displayed in Total Bytes.
You can also add more column headings by selecting View, Select Columns. Various
network measures can be added or removed; they include Bytes Throughput, Bytes
Sent/Interval, Unicast Sent and Received, and so on.
TIP
ptg
If you suspect a possible network server problem, launch the Task Manager and quickly
glance at the CPU utilization, memory available, process utilization, and network utiliza-
tion information. When the utilization of any or all of these items exceeds 60% to 70%,
there might be a bottleneck or overutilization of a resource, causing pressure. However,
if all the utilization information shows demand being less than 5%, the problem is prob-
ably not related to server operations.
Monitoring User Activity
The final tab on the Task Manager is the Users tab, which displays a list of the users who
are connected to or logged on to the server, session status, and names. The following five
columns are available on the Users tab:
.
User—
Shows the users logged on the server. As long as the user is not connected via
a console session, it is possible to remote control the session or send a message.
Remote control can be initiated by right-clicking the user and selecting Remote
Control. The level of control is dictated by the security settings configured in
Remote Desktop.
.
ID—
Displays the numeric ID that identifies the session on the server.
.
Status—
Displays the current status of a session. Sessions can be either Active or
Disconnected.
.
Client Name—
Specifies the name of the client computer using the session, if
applicable.
.
Session—
Displays which session the user is logged on with.
1350
CHAPTER 33
Logging and Debugging
Using Event Viewer for Logging and Debugging
Event Viewer is the next tool to use when debugging, problem solving, or troubleshooting
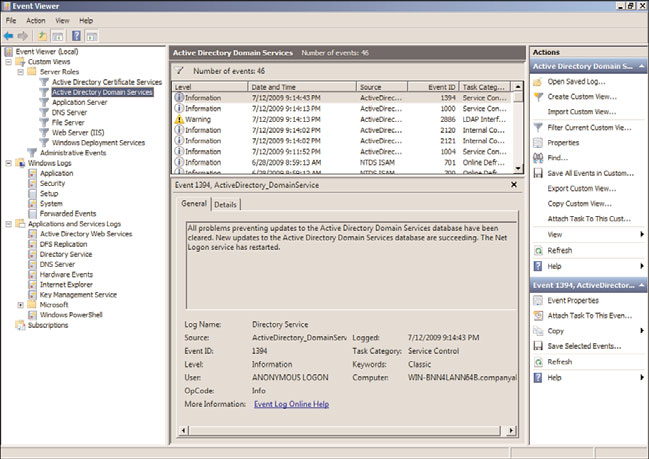
to resolve a problem with a Windows Server 2008 R2 system. Event Viewer, as shown in
Figure 33.3, is a built-in Windows Server 2008 R2 tool completely rewritten based on an
Extensible Markup Language (XML) infrastructure, which is used for gathering trou-
bleshooting information and conducting diagnostics. Event Viewer was completely rewrit-
ten in Windows Server 2008 and many new features and functionality were introduced,
including a new user interface and a home page, which includes an overview and
summary of the system.
ptg
FIGURE 33.3
Event Viewer, including the Overview and Summary pane.
The upcoming sections focus on the basic elements of an event, including detailed
sections covering the new features and functionality.
Microsoft defines an event as any significant occurrence in the operating system or an
application that requires tracking of the information. An event is not always negative. A
successful logon to the network, a successful transfer of messages, or replication of data
can also generate an event in Windows. It is important to sift through the events to deter-
mine which are informational events and which are critical events that require attention.
When server or application failures occur, Event Viewer is one of the first places to check
for information. Event Viewer can be used to monitor, track, view, and audit security of
your server and network. It is used to track information of both hardware and software
contained in your server. The information provided in Event Viewer can be a good starting
point to identify and track down the root cause of any system errors or problems.
Using Event Viewer for Logging and Debugging
1351
Event Viewer can be accessed through the Administrative Tools menu or by expanding the
Diagnostics section of the new Server Manager MMC snap-in. You can also launch Event
Viewer by running the Microsoft Management Console (Start, Run, mmc.exe) and adding
the snap-in or through a command line by running eventvwr.msc.
Each log has common properties associated with its events. The following bullets define
these properties:
.
Level—
This property defines the severity of the event. An icon appears next to each
type of event. It helps to quickly identify whether the event is informational, a
warning, or an error.
33
.
Date and Time—
This property indicates the date and time that the event occurred.
You can sort events by date and time by clicking this column. This information is
particularly helpful in tracing back an incident that occurred during a specific time
period, such as a hardware upgrade before your server started experiencing problems.
.
Source—
This property identifies the source of the event, which can be an applica-
tion, remote access, a service, and so on. The source is very useful in determining
what caused the event.
.
Event ID—
Each event has an associated event ID, which is a numeral generated by
the source and is unique to each type of event. You can use the event ID on the
ptg
Microsoft Support website (www.microsoft.com/technet/) to find topics and solu-
tions related to an event on your server.
.
Task Category—
This property determines the category of an event. Task Category
examples from the Security log include Logon/Logoff, System, Object Access, and
others.
Examining the New Event Viewer User Interface
The interface for Event Viewer in Windows Server 2008 R2 has changed significantly from
earlier versions. Although the information produced by logged events remains much the
same, it’s important to be familiar with the new interface to take advantage of the new
features and functionality.
Administrators accustomed to using the latest Microsoft Management Console (MMC) 3.0
will notice similarities in the new look and feel of the Event Viewer user interface. The
navigation tree on the left pane of the Event Viewer window lists the event logs available
to view and also introduces new folders for creating custom event views and subscriptions
from remote systems. The central details pane, located in the center of the console,
displays relevant event information based on the folder selected in the navigation tree.
The home page central details pane also includes a new layout to bolster the administra-
tor’s experience by summarizing administrative events by date and criticality, providing
log summaries and displaying recently viewed nodes. Finally, the tasks pane, located on
the extreme right side of the window, contains context-sensitive actions depending on the
focus in the Event Viewer snap-in.
1352
CHAPTER 33
Logging and Debugging
The folders residing in the left pane of the Event Viewer are organized by the following
elements:
. Custom Views
. Windows Logs
. Applications and Services Logs
. Subscriptions
The Custom Views Folder
Custom views are filters either created automatically by Windows Server 2008 R2 when
new server roles or applications such as Active Directory Certificate Services and DHCP
Server are added to the system or manually by administrators. It is important for adminis-
trators to have the ability to create filters that target only the events they are interested in
viewing to quickly diagnose and remediate issues on the Windows Server 2008 R2 system
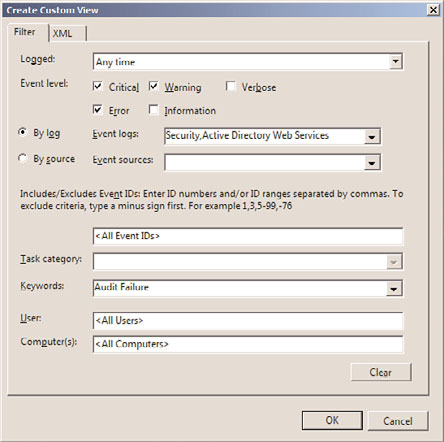
and infrastructure. By expanding the Custom Views folder in the Event Viewer navigation
tree and right-clicking Administrative Events, selecting Properties, and clicking the Edit
Filter button, you can see how information from the event log is parsed into a set of
filtered events. The Custom View Properties Filter tab is displayed in Figure 33.4. In the
built-in Administrative Events custom views, all critical, error, and warning events are
ptg
captured for all event logs. Rather than looking at the large number of informational logs
captured by Windows Server 2008 R2 and cycling through each Windows log, this filter
gives the administrator a single place to go and quickly check for any potential problems
contained on the system.
FIGURE 33.4
The Filter tab located in the Custom View Properties page.
Using Event Viewer for Logging and Debugging
1353
Also listed in the Custom View section of Event Viewer are predefined filters created by
Windows Server 2008 R2 when new roles are added to the system. These queries cannot
be edited; however, they provide events related to all Windows Server 2008 R2 roles and
the logical grouping can be used to quickly drill down into issues affecting the perfor-
mance of the system as it relates to specific server roles. Again, this is a way of helping an
administrator find the information needed to identify and ultimately resolve server prob-