Windows Server 2008 R2 Unleashed (268 page)
Read Windows Server 2008 R2 Unleashed Online
Authors: Noel Morimoto

NOTE
You must be a member of the Backup Operators group at the minimum to archive an
event log.
Logs archived in the new log-file format (.evtx) can be reopened using the Windows
Server 2008 R2 Event Viewer utility. Logs saved in log-file format retain the XML data for
each event recorded. Event logs, by default, are stored on the server where the Event
Viewer utility is being run. Data can, however, be archived to a remote server by simply
providing a UNC path (such as \\servername\share\) when entering a filename.
Logs archived in comma-delimited (.csv) or text (.txt) format can be reopened in other
programs such as Microsoft Word or Excel. These two formats do not retain the XML data
or formatting.
1358
CHAPTER 33
Logging and Debugging
Customizing the Event Log
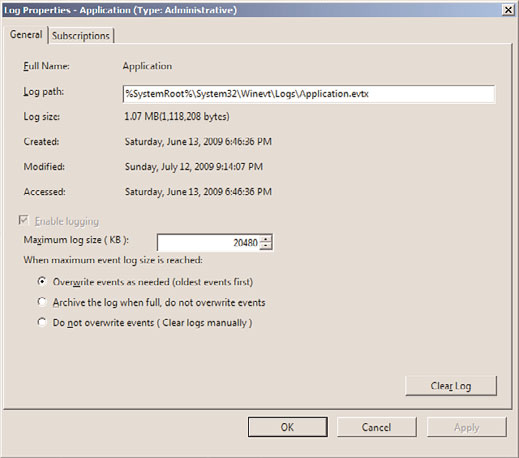
The properties of an event log can be configured. In Event Viewer, the properties of a log
are defined by general characteristics: log path, current size, date created, when last
modified or accessed, maximum size, and what should be done when the maximum log
size is reached.
To customize the event log, access the properties of the particular log by highlighting the
log and selecting Action and then Properties. Alternatively, you can right-click the log
and select Properties to display the General tab of the log’s property page, as shown in
Figure 33.5.
ptg
FIGURE 33.5
Selecting properties for the event log.
The Log Size section specifies the maximum size of the log and the subsequent actions to
take when the maximum log size limit is reached. The three options are as follows:
. Overwrite Events as Needed (Oldest Events First)
. Archive the Log When Full, Do Not Overwrite Events
. Do Not Overwrite Events (Clear Logs Manually)
If you select the Do Not Overwrite Events option, Windows Server 2008 R2 stops logging
events when the log is full. Although Windows Server 2008 R2 notifies you when the log
Performance and Reliability Monitoring
1359
is full, you need to monitor the log and manually clear the log periodically so new events
can be tracked and stored in the log file.
In addition, log file sizes must be specified in multiples of 64KB. If a value is not in multi-
ples of 64KB, Event Viewer automatically sets the log file size to a multiple of 64KB.
When you need to clear the event log, click the Clear Log button in the lower right of the
property page.
Understanding the Security Log
33
Effectively logging an accurate and wide range of security events in Event Viewer requires
an understanding of auditing in Windows Server 2008 R2. It is important to know events
are not audited by default. You can enable auditing in the local security policy for a local
server, the domain controller security policy for a domain controller machine, and the
Active Directory (AD) Group Policy Object (GPO) for a domain. Through auditing, you
can track Windows Server 2008 R2 security events. It is possible to request that an audit
entry be written to the security event log whenever certain actions are carried out or an
object such as a file or printer in AD is accessed. The audit entry shows the action carried
out, the user responsible for the action, and the date and time of the action.
ptg
Performance and Reliability Monitoring
Performance is a basis for measuring how fast application and system tasks are completed
on a computer and reliability is a basis for measuring system operation. How reliable a
system is will be based on whether it regularly operates at the level at which it was
designed to perform. Based on their descriptions, it should be easy to recognize that
performance and reliability monitoring are crucial aspects in the overall availability and
health of a Windows Server 2008 R2 infrastructure. To ensure maximum uptime, a well-
thought-through process needs to be put in place to monitor, identify, diagnose, and
analyze system performance. This process should invariably provide a means for quickly
comparing system performances at varying instances in time, detecting, and potentially
preventing a catastrophic incident before it causes system downtime.
Performance Monitor, which is a Microsoft Management Console (MMC) snap-in,
provides a myriad of tools for administrators so they can conduct real-time system moni-
toring, examine system resources, collect performance data, and create performance
reports from a single console. This tool is literally a combination of three legacy Windows
Server monitoring tools: System Monitor, Performance Monitor, and Server Performance
Advisor. However, new features and functionalities have been introduced to shake things
up, including Data Collector Sets, resource view, scheduling, diagnostic reporting, and
wizards and templates for creating logs. To launch the Performance Monitor MMC snap-in
tool, select Start, All Programs, Administrative Tools, Performance Monitor, or type
perfmon.msc at a command prompt.
1360
CHAPTER 33
Logging and Debugging
The Performance Monitor MMC snap-in is composed of the following elements:
. Overview Screen
. Performance Monitor
. Data Collector Sets
. Report Generation
The upcoming sections further explore these major elements found in the Performance
Monitoring tool.
Performance Monitor Overview
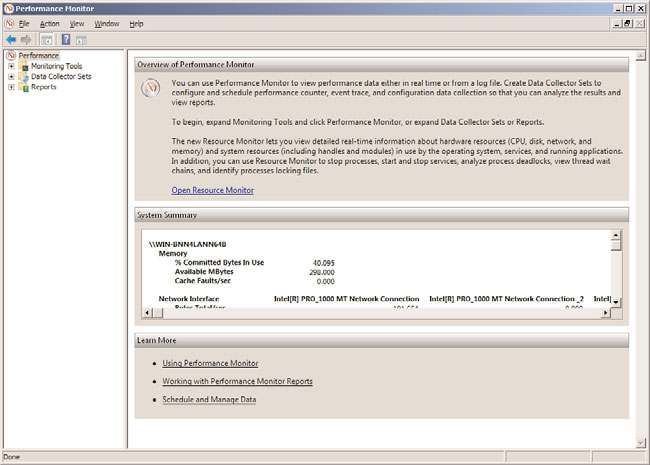
The first area of interest in the Performance Monitor snap-in is the Overview of
Performance Monitor screen, also known as the Performance icon. It is displayed as the
home page in the central details pane when the Performance Monitor tool is invoked.
The Overview of Performance Monitor screen presents holistic, real-time graphical illustra-
tions of a Windows Server 2008 R2 system’s CPU usage, disk usage, network usage, and
memory usage, as displayed in Figure 33.6.
ptg
FIGURE 33.6
Viewing the Overview of Performance Monitor screen.
Additional process-level details can be viewed to better understand your system’s current
resource usage by reviewing subsections beneath each metric being displayed. For
Performance and Reliability Monitoring
1361
example, the Memory section includes % Committed Bytes in Use, Available Mbytes, and
Cache Faults/sec.
The Overview of Performance Monitor screen is the first level of defense when there is a
need to get a quick overview of a system’s resources. If quick diagnosis of an issue cannot
be achieved, an administrator should leverage the additional tools within Performance
Monitor. These are covered in the upcoming sections.
Performance Monitor
33
Windows Server 2008 R2 comes with two tools for performance monitoring. The first tool
is called Performance Monitor and the second tool is known as Reliability Monitor. In the
previous release of Windows, the Reliability Monitor tool was included in the Reliability
and Performance snap-in. With Windows Server 2008 R2, the Reliability Monitor tool has
been removed from the Performance Monitor console. The improved Performance
Monitor tool provides performance analysis and information that can be used for bottle-
neck, performance, and troubleshooting analysis.
First, defining some terms used in performance monitoring will help clarify the function of
Performance Monitor and how it ties in to software and system functionality. The three
components noted in Performance Monitor, Data Collector Sets, and Reports are as follows:
ptg
.
Object—
Components contained in a system are grouped into objects. Objects are
grouped according to system functionality or by association within the system.
Objects can represent logical entities such as memory or a physical mechanism such
as a hard disk drive. The number of objects available in a system depends on the
configuration. For example, if Microsoft Exchange Server is installed on a server,
some objects pertaining to Exchange would be available.
.
Counter—
Counters are subsets of objects. Counters typically provide more detailed
information for an object such as queue length or throughput for an object. The
System Monitor can collect data through the counters and display it in either a
graphical format or a text log format.
.
Instances—
If a server has more than one similar object, each one is considered an
instance. For example, a server with multiple processors has individual counters for
each instance of the processor. Counters with multiple instances also have an
instance for the combined data collected for the instances.
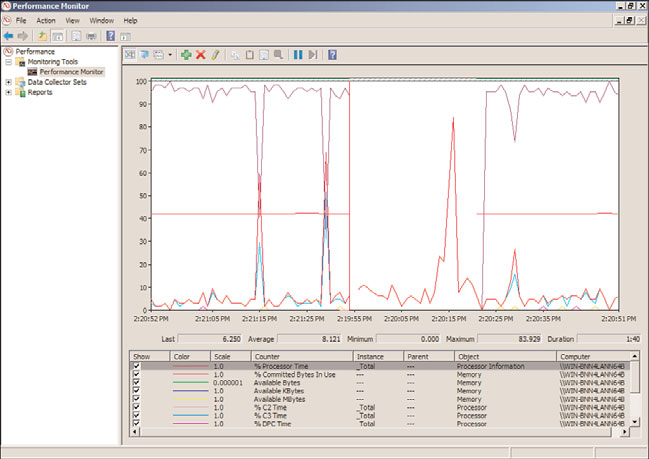
Performance Monitor provides an interface that allows for the analysis of system data,
research performance, and bottlenecks. Performance Monitor displays performance
counter output in line graphs, histogram (bar chart), and report format.
The histogram and line graphs can be used to view multiple counters at the same time, as
shown in Figure 33.7. However, each data point displays only a single value that is inde-
pendent of its object. The report view is better for displaying multiple values.
1362
CHAPTER 33
Logging and Debugging
FIGURE 33.7
The graph view of Performance Monitor.
ptg
Launching Performance Monitor is accomplished by selecting Performance Monitor from
the Monitoring Tools folder in the Performance Monitor MMC snap-in. You can also open
it from a command line by typing Perfmon.msc. When a new Performance Monitor
session is started, it loads a blank system monitor graph into the console with % Processor
Time as the only counter defined.
Adding Counters with Performance Monitor
Before counters can be displayed, they have to be added. The counters can be added
simply by using the menu bar. The Counter button on the toolbar includes Add, Delete,
and Highlight. You can use the Add Counter button to display new counters. On the other
hand, use the Delete Counter button to remove unwanted counters from the display. The
Highlight Counter button is helpful for highlighting a particular counter of interest; a
counter can be highlighted with either a white or black color around the counter.
The following step-by-step procedures depict how to add counters to Performance Monitor:
1. In the navigation tree of Performance Monitor, first expand Performance,
Monitoring Tools, and then Performance Monitoring.
2. Either click the Add icon in the menu bar or right-click anywhere on the graph and