Windows Server 2008 R2 Unleashed (270 page)
Read Windows Server 2008 R2 Unleashed Online
Authors: Noel Morimoto

tral details pane.
NOTE
The report generates and appears when the data collection process is complete. The
report is automatically tagged with the current date.
1368
CHAPTER 33
Logging and Debugging
Reliability Monitor
The Reliability Monitor was a brand-new tool first introduced with the release of Windows
Vista and then reintroduced with Windows 2008. This enhanced system management tool
is the second monitoring tool available within a Windows Server 2008 R2 system. The tool
can be invoked by selecting View Reliability History from within the Action Center. Use
this tool when you need help troubleshooting the root cause associated with reduced reli-
ability of a Windows Server 2008 R2 system. Reliability Monitor provides event details
through system stability charts and reports that help diagnose items that might be nega-
tively impacting the reliability of a system.
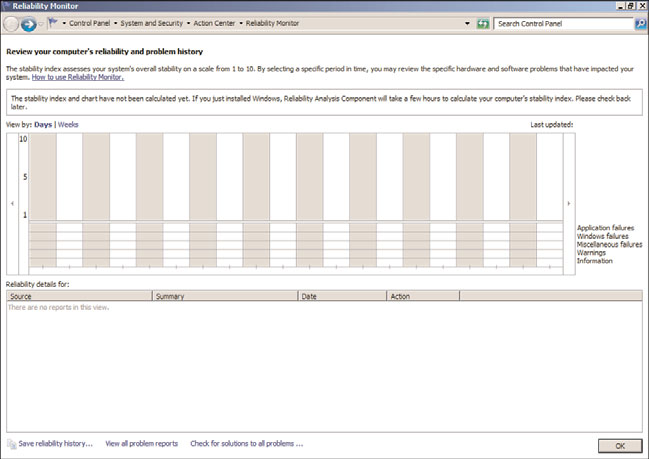
The tool uses a System Stability Index to rate the stability of a system each day over its
lifetime by means of an index scorecard that identifies any reduction in reliability. An
index rating of 1 represents a system in its least stable stage, whereas an index rating of 10
indicates a system in its most stable stage. Each day’s index rating is displayed in a System
Stability Chart graph, as illustrated in Figure 33.10. This graph typically helps administra-
tors to identify dates when stability issues with the Windows Server 2008 R2 system
occurred. Additional itemized system stability information can be found in an accompa-
nying System Stability Report section of the Reliability Monitor screen. The additional
stability information further assists by identifying the root cause of the reliability issues.
This information is grouped into the following categories: Software Installs and Uninstalls,
ptg
Application Failures, Hardware Failures, Windows Failures, and Miscellaneous Failures.
FIGURE 33.10
The Reliability Monitor screen.
Reliability Monitor is an essential tool for identifying and correlating problems with
Windows Server 2008 R2. With Reliability Monitor, an administrator can quickly identify
Setting Baseline Values
1369
changes in a system that caused a negative trend with system reliability. As such, this tool
can also help administrators anticipate other problems, which ultimately leads to solving
issues efficiently and effectively.
A baseline is a performance level that can be used as a starting point to compare against
future network performance operations. When a server is first monitored, there is very
33
little to compare the statistics against. After a baseline is created, information can be gath-
ered at any time in the future and compared against the baseline. The difference between
the current statistics and the baseline statistics is the variance caused by system load,
application processing, or system performance contention.
To be able to set a baseline value, you need to gather a normal set of statistics on each
system that will eventually be monitored or managed in the future. Baselines should be
created for normal and stressed times. The workload on a machine at night when there
are fewer users connected to it provides a poor baseline to compare real-time data in the
middle of the day. Information sampled in the middle of the day should be compared
with a baseline of information collected at around the same time of day during normal
ptg
load prior to the sample comparison.
Creating baselines should be an ongoing process. If an application or a new service is
added to a server, a new baseline should be created so that any future comparisons can be
made with a baseline with the most current status of system performance.
Reducing Performance Monitoring Overhead
Performance monitoring uses system resources that can affect the performance of a system
as well as affect the data being collected. To ensure that performance monitoring and
analyzing do not affect the machines being monitored themselves, you need to decrease
the impact of performance monitoring. Some steps can be taken to ensure that perfor-
mance monitoring overhead is kept to a minimum on the server being monitored to
create as accurate of an analysis on a system as possible:
. Use a remote server to monitor the target server. Servers can actually be dedicated to
monitoring several remote servers. Although this might also lead to an increase in
network bandwidth, at least the monitoring and tracking of information do not
drastically degrade CPU or disk I/O as if the monitoring tool were actually running
on the server being monitored.
. Consider reducing the frequency of the data collection interval because more
frequent collection can increase overhead on the server.
. Avoid using too many counters. Some counters are costly in terms of taxing a server
for system resources and can increase system overhead. Monitoring several activities
at one time also becomes difficult.
1370
CHAPTER 33
Logging and Debugging
. Use logs instead of displaying graphs. The logs can then be imported into a database
or report. Logs can be saved on hard disks not being monitored or analyzed.
Important Objects to Monitor
The numbers of system and application components, services, and threads to measure in
Windows Server 2008 R2 are so extensive that it is impossible to monitor thousands of
processor, print queue, network, or storage usage statistics. Defining the roles a server
plays in a network environment helps to narrow down what needs to be measured. Servers
could be defined and categorized based on the function of the server, such as application
server, file and print server, or services server such as DNS, domain controller, and so on.
Because servers perform different roles, and hence have different functions, it makes sense
to monitor the essential performance objects. This helps prevent the server from being
overwhelmed from the monitoring of unnecessary objects for measurement or analysis.
Overall, four major areas demand the most concern: memory, processor, disk subsystem,
and network infrastructure. They all tie into any role the server plays.
The following list describes objects to monitor based on the roles played by the server:
ptg
.
Active Directory Domain Services—
Because the DC provides authentication,
stores the Active Directory database, holds schema objects, and so on, it receives
many requests. To be able to process all these requests, it uses up a lot of CPU
resources, disks, memory, and network bandwidth. Consider monitoring memory,
CPU, system, network segment, network interface, and protocol objects such as TCP,
UDP, NBT, NetBIOS, and NetBEUI. Also worth monitoring are the Active Directory
NTDS service and site server LDAP service objects. DNS and WINS also have applica-
ble objects to be measured.
.
File and print server—
The print servers that process intensive graphics jobs can
utilize extensive resources of system CPU cycles very quickly. The file server takes up
a lot of storage space. Monitor the PrintQueue object to track print spooling data.
Also monitor CPU, memory, network segment, and logical and physical disks for
both file and print data collection.
.
Messaging collaboration server—
A messaging server such as an Exchange Server
2010 uses a lot of CPU, disk, and memory resources. Monitor memory collection,
cache, processor, system, and logical and physical disks. Exchange objects are added
to the list of objects after Exchange is installed, such as message queue length or
name resolution response time.
.
Web server—
A web server is usually far less disk intensive and more dependent on
processing performance or memory space to cache web pages and page requests.
Consider monitoring the cache, network interface, processor, and memory usage.
.
Database server—
Database servers such as Microsoft SQL Server 2008 can use a lot
of CPU and disk resources. Database servers can also use an extensive amount of
Using the Debugging Tools Available in Windows Server 2008 R2
1371
memory to cache tables and data, so RAM usage and query response times should be
monitored. Monitoring objects such as system, processor, logical disk, and physical
disk is helpful for overall system performance operations.
Using the Debugging Tools Available in Windows
Several useful tools are available in Windows Server 2008 R2 for troubleshooting and diag-
33
nosing various problems ranging from TCP/IP connection issues to verification and main-
tenance issues. These tools also make it much easier for IT professionals and
administrators, allowing IT personnel to focus on business improvement tasks and func-
tions, not on simply running specific tools in the networking environment.
Best Practices Analyzer Tools
Many years ago, Microsoft introduced Best Practices Analyzer (BPA) tools for server prod-
ucts such as SQL Server and Exchange. The tools would enable an IT professional to
conduct a scan against a product to ensure it was configured based upon industry best
ptg
practices. For many years, IT professionals wanted a similar tool to scan their Windows
infrastructure; however, one did not exist. Windows Server 2008 R2 now introduces a Best
Practice Analyzer tool, which is included with all editions of the server except for Server
Core. When scanning Server Roles to find best-practice violations, the BPA tool will
measure a server role’s compliance based upon eight different rule categories. The rule
categories include Security, Performance, Configuration, Policy, Operation,
Predeployment, Postdeployment, and BPA Prerequisites. Compliance is measured based
upon three severity levels: Noncompliant, Compliant, and Warnings. It is worth noting
that only a select few server roles are supported with BPA.
Note: The Windows BPA tool should be run on a regular basis to alleviate incorrect config-
urations, poor performance, poor reliability, and security violations.
Follow these steps to launch the Best Practice Analyzer tool:
1. Click Start, All Programs, and then select Server Manager.
2. In the tree pane, expand the Roles section.
3. Select a server role that you want to scan—for example, Active Directory Domain
Services (AD DS).
4. In the details pane, open the Best Practice Analyzer section and then select Scan This
Role.
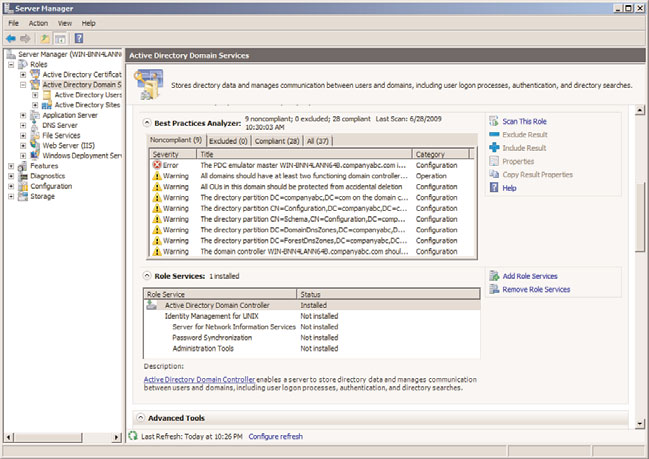
5. Once the scan is complete, review the results in the same Best Practices Analyzer sec-
tion, as displayed in Figure 33.11. Each result is categorized by Noncompliant,
Excluded, Compliant, and All tabs.
1372
CHAPTER 33
Logging and Debugging
FIGURE 33.11
The Best Practices Analyzer Results screen.
ptg
When using the GUI to run a Best Practices Analyzer scan, it is possible to exclude scan
results for a specific role. This can be achieved by selecting a result from the
Noncompliant, Compliant, or All tabs and then clicking the Exclude link. Alternatively,
you can exclude more than one result by holding down the CTRL key, selecting more
than one result and then clicking Exclude.
TCP/IP Tools
TCP/IP forms the backbone of communication and transportation in Windows Server