Windows Server 2008 R2 Unleashed (132 page)
Read Windows Server 2008 R2 Unleashed Online
Authors: Noel Morimoto

.
AD DS Tools—
These are tools such as the AD Domains and Trusts console, the ADSI
Edit console, and the NTDSUTIL tool.
.
Directory Services Tools—
These include DSADD, DSGET, and DSMGMT tools.
.
Networking and Other Tools—
These include such tools as NSLOOKUP and
W32TM.
The tools can be launched by clicking on the active links. In the case of console tools, the
console will be launched. In the case of command-line tools, the tool will be launched
ptg
with the help option to display the options for the tool.
For example, after installing the Active Directory Domain Services role on a server, you
can use the Advanced Tools section to launch DCPROMO to complete the configuration
of the domain services.
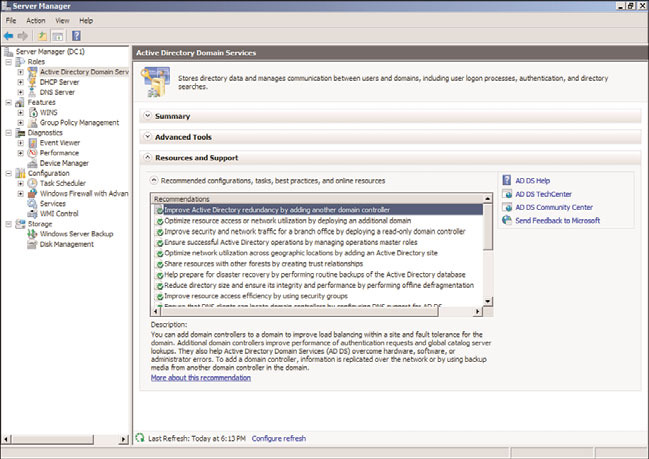
Resources and Support Section
The Resources and Support section is an extremely useful section. It provides a brief
recommendation on configurations, best practices, and links to resources.
The recommendations are listed in a window; highlighting the recommendation shows a
brief explanation of the recommendation with a link to a more detailed explanation. This
is great for researching the recommendations. The section also includes links to online
resources, such as the appropriate TechCenter and Community Center for the role.
For example, the Resources and Support section for the Active Directory Domain Services
role (shown in Figure 20.4) includes over 18 different recommendations on installation.
One of the recommendations is Improve Active Directory Redundancy by Adding Another
Domain Controller. Highlighting this recommendation shows a brief paragraph explain-
ing the recommendation and includes a link to get more detailed information on the
recommendation.
An important note is that these recommendations are static and don’t adjust to changes
in the environment.
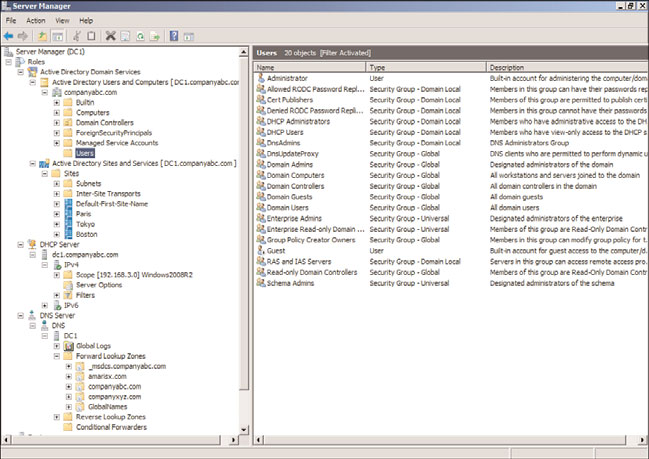
Tools Folders
For each of the role folders in the Server Manager folder tree, there are subfolders that are
the MMC snap-ins for the role. This is a cool feature that makes it easy to access the tools
Server Manager
651
FIGURE 20.4
Resources and Support section.
ptg
from within Server Manager without having to search for the tools in the Administrative
Tools folder.
For example, the Active Directory Domain Services role has two tools folders: the Active
Directory Users and Computers snap-in and the Active Directory Sites and Services snap-
in, shown in Figure 20.5.
As can be seen in the figure, these are the same full-featured snap-ins that can be launched
from the Administrative Tools folder. The Users container is selected in the figure, and
contents of the container can be seen.
For the other roles on the server (the DHCP Server role and DNS Server role), the respec-
tive tools can be seen as well.
Server Manager Features Page
The Features page shows a summary of the installed features. There are active links to add
20
and remove features, as well as a link to get help.
In the case of some features, there will be a folder under the Features folder that is the
MMC snap-in for the feature. For example, the Active Directory Domain Services role
automatically installs the Group Policy Management feature. This places the Group Policy
Management Console under the Features folder.
652
CHAPTER 20
Windows Server 2008 R2 Management and Maintenance Practices
FIGURE 20.5
Role tools folders.
ptg
Server Manager Diagnostics Page
The Diagnostics page in Server Manager consolidates three different consoles into a conve-
nient location. The three consoles are as follows:
. Event Viewer
. Performance
. Device Manager
The next sections review the various features of the three consoles on the Diagnostics page.
Event Viewer
The Windows Server 2008 R2 Event Viewer functionality has been improved over the
Windows Server 2003 version. The version in Windows Server 2008 R2 is the version that
released in Windows Vista. The event logs can contain an overwhelming volume of infor-
mation, which the new Event Viewer summarizes and drills into very effectively.
Selecting the Event Viewer folder under Diagnostics shows the Overview and Summary
page. The Summary of Administrative Events section on this page shows a high-level
summary of the administrative events, organized by level:
. Critical
. Error
. Warning
Server Manager Diagnostics Page
653
. Information
. Audit Success
. Audit Failure
The view shows the total number of events in the last hour, 24 hours, 7 days, and the
total. Each of these nodes can be expanded to show the counts of particular event IDs
within each level. Double-clicking on the event ID count shows a detailed list of the
events with the matching event ID. This is very useful for drilling on the specific events to
see when they are occurring.
The Overview and Summary page also has a Log Summary section, which shows a list of
all the various logs on the server. This is important, as there are now over 100 different
logs in Windows Server 2008 R2. In addition to the standard system, security, and applica-
tion logs, there is a setup log and a forwarded events log. Then there are the numerous
application and services logs, which include logs for each application, service, and a huge
number of diagnostic and debugging logs. For each of the logs, the Log Summary section
shows the log name, current size, maximum size, last modification, if it is enabled, and
what the retention policy for the log is. This allows the administrator to quickly see the
status of all the logs, which would be a daunting task otherwise.
Of course, the logs can be viewed directly by expanding the Windows Logs folder or the
ptg
Applications and Services Logs folder. The Windows Logs folder contains all the standard
application, security, setup, system, and forwarded events logs. The applications and
services logs contain all the other ones.
Custom views can be created to filter events and combine logs into a coherent view. There
is a default Administrative Events view, which combines the critical, error, and warning
events from all the administrative logs. There is also a custom view created for each role
that is installed on the server. New ones can be created by the administrator as needed.
Subscriptions can collect events from remote computers and store them in the forwarded
events log. The events to be collected are specified in the subscription. The functionality
depends on the Windows Remote Management (WinRM) and the Windows Event
Collector (Wecsvc) services, and they must be running on both the collecting and
forwarding servers.
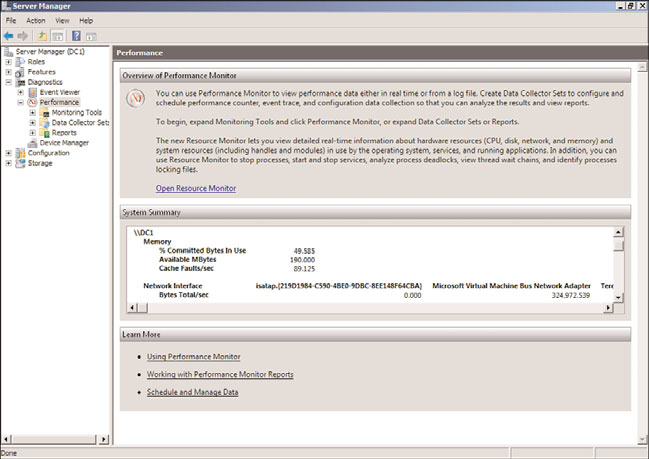
Server Manager Performance Monitor
The Performance monitor is incorporated into Server Manager as well. This diagnostic tool
20
enables the administrator to monitor the performance of the server in real time, generate
reports, and also save the performance data to logs for analysis.
The top-level folder of the Performance Monitor displays the System Summary. This gives
a comprehensive overview of the memory, network interface, physical disk, and processor
utilization during the past 60 seconds (shown in Figure 20.6). The System Summary is
organized in a matrix, with a column for each instance of the network interface, disk, and
processor. The information is updated every second. Unfortunately, the pane is a fixed
height, so it is hard to see all the information at once, and excessive scrolling is needed.
654
CHAPTER 20
Windows Server 2008 R2 Management and Maintenance Practices
FIGURE 20.6
System Summary in Performance Monitor.
ptg
The Monitoring Tools contains the Performance Monitor tool. This tool allows you to
monitor the performance of the server in more detail. The Performance Monitor has not
really changed from previous versions of Windows. It allows you to select performance
counters and add them to a graph view for real-time monitoring. The graph can be config-
ured to be a line graph, a bar graph, or even a simple text report of the counters being
monitored. The monitor shows the last, average, minimum, maximum, and duration of
the windows (1 minute 40 seconds by default).
For longer-term tracking, the Data Collector Sets can be used. Data Collector Sets can log
data from the following data sources:
. Performance counters
. Event traces
. Registry key values
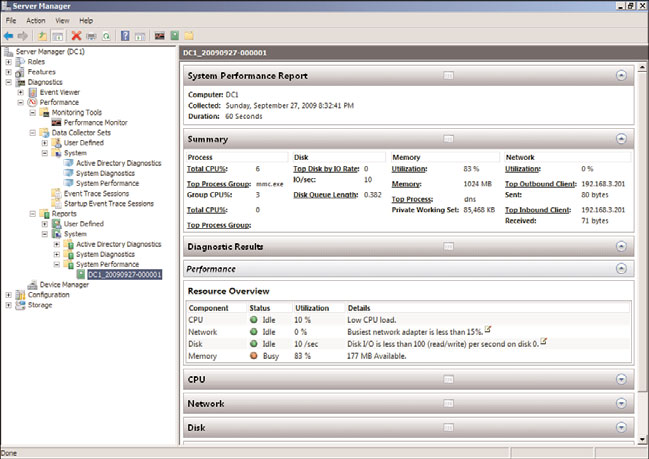
This data can be logged over an extended period of time and then reviewed. The data
collected will also be analyzed and presented in reports that are very useful. There are two
reports defined by default, the System Diagnostics and System Performance. When roles
are added, such as the Active Directory Domain Services role, there might be additional
Data Collector Sets defined. These data sets gather data that is presented in reports, which
is new to Windows Server 2008 R2. There is a new reports folder in the Performance
Monitor where the reports are saved.
To generate data for a Performance Monitor report, execute the following steps:
Server Manager Diagnostics Page
655
1. Launch Server Manager.
2. Expand the Diagnostics node.
3. Expand the Performance node.
4. Expand the Data Collector Sets node.
5. Expand the System node and select the System Performance Data Collector Set. Note
that the Data Collector Set includes an NT Kernel trace and performance counters.