Understanding Sabermetrics (36 page)
Read Understanding Sabermetrics Online
Authors: Gabriel B. Costa,Michael R. Huber,John T. Saccoma

MA488 PROJECT: MODELING BINARY OUTCOMES IN BASEBALL1. Identify a Binary Baseball Outcome you would like to examine and predict. Examples (think of others):• Wins/Losses in games — predict using either a player’s stats (as in class example) or team stats (errors in the game, hits in the game, HRs in the game etc.)• Team makes the playoffs or doesn’t — could use any number of predictors: ERA, fielding pct. (pitching and defense win championships), batting average, etc.• Player makes Hall of Fame or not2. Collect data to try to build a model for predicting the outcome (note: start early and let instructors know if you have problems finding the data).3. Using logistic regression, build a model (or models) to predict the response. Clearly describe the predictors you tried, and how you decided on your final model.4. For the final model, check goodness of fit as well as model assumptions. Are there any influential observations in the data? If so, why (and how do they impact the model)?5. Regardless of whether your model is significant or not, interpret the results. What are the model-based probabilities of your outcome for various values of the predictors? What are the odds ratios for the predictors, and what do they tell you?6. What conclusions can you draw about predicting your outcome? What, if anything, might allow you to improve your model is you had more time or data?
MA 488 IN-CLASS ASSIGNMENT: THE DESIGNATED HITTERTen Arguments For1. Since 1973 it has “modernized” baseball.2. Baseball must change with the times.3. Virtually every league (except the NL) uses it.4. Real baseball fans want offense.5. Pitchers can’t hit.6. Older, great hitters can still hit.7. There is no advantage for the AL/NL regarding inter-league play.8. “Specialists” are good for baseball.9. There is more strategy with the DH.10. (Write your own.)Ten Arguments Against1. Since 1973, “pure” baseball doesn’t exist.2. Baseball should retain its tradition.3. It should be banned in every other league.4. Real baseball fans want pitching and defense.5. Pitchers can hit.6. Older, great hitters can’t run or field.7. The AL/NL has an advantage over the NL/AL regarding inter-league play.8. “Specialists” are bad for baseball.9. There is more strategy without the DH.10. (Write your own.)A Question Regarding the Boston Red Sox (c. 1914)You are “Rough” Carrigan, the manager of the Red Sox. There’s this left-handed pitcher from Baltimore. He’s got a lot to learn, but an awful lot of potential. Do you spend every bit of time with him polishing up his pitching skills, or do you waste his time and yours letting him hit in batting practice?
MA488 IN-CLASS ASSIGNMENT: A WEIGHTED FIBONACCI APPROACH TO PREDICTIONIntroduction:
Bill James has used a “Fibonacci Approach” in some of his research. One basic application of this idea is to go back two seasons to “predict” a statistic for an upcoming season. Let us consider a modification to this, in an attempt to derive a statistic which will predict the number of home runs a player will hit as he approaches the prime of his career.Example:
Babe Ruth hit 467 HRs in the 1920s; this is still the record for any decade. In 1925 he was 30 years old. Suppose we try to anticipate his home run total for 1925, based on his two previous seasons.• In 1923, Ruth hit 41 HR in 522 AB for a home run ratio (HRR) of 0.0785• In 1924, Ruth hit 46 HR in 529 AB for a HRR of 0.0870Let us define Ruth’s 1925 Weighted Fibonacci HRR (WFHRR) asWFHRR
1925
= (1/3)
HRR
1923
+ (2/3)
HRR
1924
= (1/3)(0.0785) + (2/3)(0.0870)=0.0842.Assuming Ruth would have 525 AB in 1925, his predicted HR total would be 44.Follow Up:
Ruth actually hit 25 HR in 1925. He was only 30 years old. What happened?Questions:
Is this a reasonable predictor? If so, over what time interval? Should the “weights” be changed? How many yearly AB should be assumed?Class Exercise:
Using the above definition, predict the following seasonal HR totals for the following sluggers:Now, use a scatter plot to compare their predicted HR totals with the actual total. Is this a good predictor?
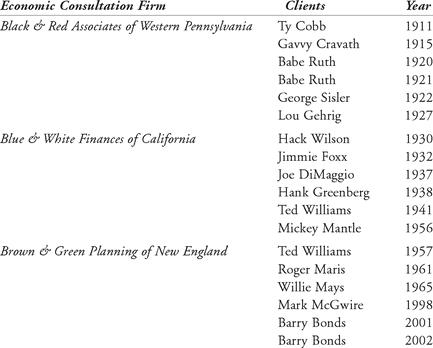
MA 488 IN-CLASS ASSIGNMENT: TIME TRAVELScenario:
The year is 2040. You are enjoying your partnership with a fellow USMA graduate, getting richer by the hour. Your expertise involves financial consultation, while limiting your clients to MLB players, past and present.You travel to the year 2008 in your new 2040 Chronosphere. Your firm has been tasked to determine:• The seasonal total power quotient (TPQ) for your each of your clients• The seasonal
relative
TPQ for each of your clients:Once these figures are determined, you will renegotiate the contacts of your clients, based on your research.
MA 488 MIDTERM EXAMINATIONREAD THESE INSTRUCTIONS CAREFULLY BEFORE STARTING WORK.1. Place all textbooks, etc., neatly in the hallway.2. Print your name and section on every sheet used.3. For this examination, references authorized are:a. Notesb. Calculatorc. Laptop computer (no wireless/Internet access)4. Sufficient work is required to indicate clearly the method of reasoning and the operations performed. SHOW ALL WORK. Clearly indicate your final answer.5. All work written on the WPR will be graded unless marked through or explicitly marked with words to the effect of “do not grade.”6. Work only on the front side of a sheet of paper. If you need more space, use a separate sheet for each problem continued. Clearly indicate which problem is continued by writing “
Cont’d on sheet _____
” on the problem sheet and “
Prob ____ cont’d
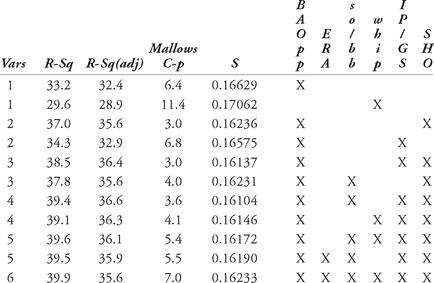
” on the additional sheet. Be sure to put your name on the continuation sheet.7. Early departure is authorized. Place completed WPRs in the instructor folder on the instructor’s desk.Question 1Henry Benjamin Greenberg’s career spanned from 1930 through 1947, playing all but one year for the Detroit Tigers. A right-handed slugging first baseman, his power rivaled that of Lou Gehrig and Jimmie Foxx. Greenberg was among the first major league players to enter into military service during World War II, which caused him to lose approximately four years of active play. Nevertheless, Greenberg amassed 331 home runs (HR) in 5193 at-bats (AB). He also walked (W) 844 times.a. Project Hank Greenberg’s home run total if he had a total of 13,000 plate appearances (AB + W), and assuming he would have been 3 percent better (the “kicker”) during the years he missed.b. Given the same number of additional AB and W as above, what “kicker” would be needed to give a projected HR total of 713?c. Consider Greenberg’s original totals. Find the number of additional AB needed to arrive at a HR total of 713 if he was 3 percent better during these additional AB.d. Do these results seem reasonable?Question 2An “All Subsets” regression in MINITAB based on pitching statistics from 1876-1881 yields the following output.Response is w/gsa. Suggest which variable(s) to incorporate in an appropriate model to predict wins per game started. Clearly explain what criterion guided your choice.b. List one of the guiding assumptions in multiple regression and describe how you would go about checking its validity.Question 3You are a New York sportswriter preparing an article comparing the Hall-of-Fame credentials of Gil Hodges and Don Mattingly. Discuss how you would use MINITAB to make an informed comparison.Question 4Starting pitchers are asked to pitch more innings in each game than relief pitchers (even in today’s game of specialists). As a result, a batter usually has more than one chance to “see” the pitcher — arguably an advantage for the hitter in later at bats. Thus, one might expect that each time through the batting order a pitcher is likely to get hit more heavily. The data in the Minitab project “fy072 wpr time through order data.MPJ” consists of a random sample of 30 pitchers with at least 25 innings pitched to hitter a faced a third time in a game. The data itself includes the name of the pitcher (Player), the pitcher’s team (Team), then the number of games (G), innings pitched (IP) and earned run average (ERA) for each pitcher for a given time seeing the batter in the ballgame. The final variable (Order) gives which time through the order the pitcher statistics refer to, with a 1 meaning the 1st time through the order and thus facing a batter, 2 the 2nd time though, 3 the 3rd time and 4 meaning 4th (or more) time through the order. Use this data to answer the questions below.a. Ignoring the player, is there a statistical difference in pitcher ERA based upon which time through the batting order? (Support your answer.)b. Does accounting for the player in the model change the results? (Support your answer.) Does this answer surprise you? (Explain why or why not.)c. Using either model from a) or b), which (if any) times through the order differ statistically and how? (If none differ, which are closest to having a statistical difference?)d. Examine the model assumptions for the model you chose in c) Is there anything of concern? (Explain.)e. What is one possible problem with answering this question using the data provided? (Explain.)
Other books
Once Upon a Wallflower by Wendy Lyn Watson
The Academy by Rawlins, Zachary
Full of Grace by Misty Provencher
The Max Brand Megapack by Max Brand, Frederick Faust
The Deepest Water by Kate Wilhelm
Yes, No, Maybe by Emma Hillman
House of Shards by Walter Jon Williams
Ring of Fire Book Two of the McKay's by Hestand, Rita
Deadly Race by Margaret Daley
Shampoo and a Stiff by Cindy Bell


