Understanding Sabermetrics (31 page)
Read Understanding Sabermetrics Online
Authors: Gabriel B. Costa,Michael R. Huber,John T. Saccoma

In 1954, the NL POP was 1.007, Mays’s 1.423, so his relative POP was 1.423 / 1.007 = 1.413, meaning that Mays’s POP was 41 percent better than the league average.
(2)
These players’ total averages are more than 250 percent better than their leagues’ figures. Bonds was about 261 percent better than the league in 2001, and Ruth was about 255 percent better than the league in 1921.
(3)
One suggestion: (POP × 1000) + (TA × 1000) + PMT, to put things roughly on a scale in which 3000 is excellent.
This is a tough one. Few people would doubt that Barry Bonds is the best player of these three sluggers. And of late he has had arguably the greatest offensive seasons ever. However, he broke the 50 home run mark only once (when he hit 73 in 2001). Mark McGwire, on the other hand, has the best career home run frequency of all time, and he four times hit 50 home runs in a season (hitting 60 or more twice). Yet, a strong case can be made for Sammy Sosa, with respect to home run peak value. He is the only player in history to hit 60+ home runs three times, not to mention a 50 home run season in 2000.
An Outside PitchWith all respect to Heilmann (4 batting titles in the 1920s), the seven crowns won by Musial and the eight titles garnered by Gwynn, it is difficult to rank Cobb anywhere but first with respect to batting titles. He won a dozen titles in 13 years, facing competition from such hitters as Tris Speaker, Nap Lajoie and Joe Jackson (who sported lifetime batting averages of .345, .338, and .356, respectively). Cobb’s lifetime average is nearly 8 points better than runner-up Rogers Hornsby. And he batted less than .300 only once in 24 seasons.
A Fork BallJohn, Blyleven, Kaat, and Morris had career victory totals of 288, 287, 283, and 254, respectively. In 26 years, Tommy John was a 4-time All-Star and twice came in second in Cy Young Award voting. He won 20 or more games in a season only three times, and his winning percentage was .555. In 22 seasons, Bert Blyleven was a 2-time All-Star, and twice came in third place in Cy Young Award voting. He won 20 games in a season only once and finished with a .534 winning percentage. In 25 seasons, Jim Kaat was voted to only one All-Star game and received votes only once for the Cy Young Award. He won 20 or more games in a season three times, and his winning percentage was .544. Jack Morris pitched 18 years in the major leagues, garnering five All-Star appearances, receiving votes for the Cy Young Award seven times (highest place was third, and it happened twice) and league MVP Award six times. He won 20 or more games in a season three times, and his winning percentage was .577. Despite his shortage of wins compared to the other three, Jack Morris could be argued as having the best career value. In addition, he has three World Series rings, as many as the other three hurlers combined.
An Intentional WalkHere is the data on the Pittsburgh Pirates:


Barry Bonds won the MVP Award in 1990 and 1992, placing 2nd in 1991. The OPS for 1990 and 1991 are identical, with little difference in ERA and runs. Both 1990 and 1991 teams had only one 20-game winner. The 1990 Cincinnati Reds beat the Pirates and went on to win the World Series, while the Braves beat the Pirates the next two years, only to lose in the Series to Minnesota and Toronto. Bonds went 13 for 68 in the three series, posting a sub-.200 batting average, while the Pirates themselves, batted .194, .224, and .255 in the three series.
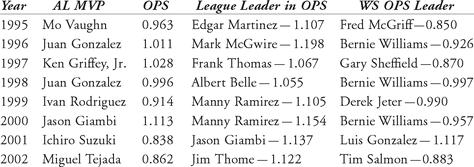
Hit and RunHere is the data:


The Yankees obviously won it all, which is the goal of every team. The Mariners proved to be a disappointment, losing the ALCS to the New York Yankees in five games.
Inning 3: The Equivalence Coefficient(1)
We find that Greenberg would get 4257 additional at bats. The kicker of 1.02 gives an equivalence coefficient of 1.836. Multiplying this by 331 gives a projected home run total of 608.
We find that Greenberg would get 4257 additional at bats. The kicker of 1.02 gives an equivalence coefficient of 1.836. Multiplying this by 331 gives a projected home run total of 608.
(2)
Don Mattingly would get an additional 4067 at bats; the kicker of 1.01 yields an equivalence coefficient of 1.589. Mattingly had 2153 hits in his career; his projected total would be 3416.
Don Mattingly would get an additional 4067 at bats; the kicker of 1.01 yields an equivalence coefficient of 1.589. Mattingly had 2153 hits in his career; his projected total would be 3416.
(3)
Koufax’s earned run average goes down from 2.76 to 2.72. In the 1200 additional innings, he would have given up 368 earned runs; the kicker is 1.04.
Koufax’s earned run average goes down from 2.76 to 2.72. In the 1200 additional innings, he would have given up 368 earned runs; the kicker is 1.04.
(4)
J.R.’s new ERA becomes 3.09; The kicker is 1.05. His additional strikeouts are 976, giving him a new strikeout total of 1493 + 976 = 2469.
Hard SliderJ.R.’s new ERA becomes 3.09; The kicker is 1.05. His additional strikeouts are 976, giving him a new strikeout total of 1493 + 976 = 2469.
(1)
The Splendid Splinter’s projected totals are: 3377 hits, 665 home runs and a batting average of .349.
The Splendid Splinter’s projected totals are: 3377 hits, 665 home runs and a batting average of .349.
(2)
Warren Spahn’s kicker is 0.95. By giving him 750 additional IP, he would have won 52 additional games. Multiplying 52 by 0.95, we see that Spahn would have won 49 games in the three seasons he missed, giving him a total of 363 + 49 = 412, or just 5 wins behind Walter Johnson.
Inning 4: The Linear Weights School — OffenseWarren Spahn’s kicker is 0.95. By giving him 750 additional IP, he would have won 52 additional games. Multiplying 52 by 0.95, we see that Spahn would have won 49 games in the three seasons he missed, giving him a total of 363 + 49 = 412, or just 5 wins behind Walter Johnson.
1.
2.
3.
4.
1.
2.
3.
Other books
Dancer at Silver Spires by Ann Bryant
Elusive Dawn by Hooper, Kay
Paddy Whacked: The Untold Story of the Irish American Gangster by T. J. English
Unknown by Unknown
Run With Me (Fight For You Book 1) by Evans, J.C.
Spook Squad by Jordan Castillo Price
Kill by Numbers: In the Wake of the Templars Book Two by Loren Rhoads
Appointment with Yesterday by Celia Fremlin
One More Kiss (Affair Without End Book 2) by Ward, Susan


