The End of Growth: Adapting to Our New Economic Reality (21 page)
Read The End of Growth: Adapting to Our New Economic Reality Online
Authors: Richard Heinberg
Tags: #BUS072000

FIGURE 24.
World Coal Production Forecast.
Source: Energy Watch Group, 2007.
In the US, most experts still rely on decades-old coal reserves assessments that are commonly (though erroneously) interpreted as indicating that the nation has a 250-year supply. This reliance on outdated and poorly digested data has lulled energy planners, policy makers, and the general public into a dangerous complacency. In terms of the energy it yields, domestic coal production peaked in the late 1990s (more coal is being mined today in raw tonnage, but the coal is of lower and steadily declining energy content). Recent US Geological Survey assessments of some of the most important mining regions show rapid depletion of accessible reserves.
17
No one doubts that there is still an enormous amount of coal in the US, but the idea that the nation can increase total energy production from coal in the years ahead is highly doubtful.
Add to this an exploding Chinese demand for coal imports, and the inevitable result will be steeply rising coal prices globally, even in nations that are currently self-sufficient in the resource. Higher coal prices will in turn torpedo efforts to develop “clean coal” technologies, which on their own are projected to add significantly to the cost of coal-based electricity.
18
OECD energy demand declined in response to the 2008 financial crisis. If financial turmoil (with resulting reductions in employment and consumption) were to continue in the US and Europe and spread to China, this could help stretch out world coal supplies and keep prices relatively lower. But an economic recovery would quickly lead to much higher energy prices — which in turn would likely force many economies back into recession.
The future of world natural gas supplies is a bit murkier. Conventional natural gas production is declining in many nations, including the US.
19
However, in North America new unconventional production methods based on hydro-fracturing of gas-bearing rocks of low permeability are making significantly larger quantities of gas available, at least over the short term — though at a higher production cost. Due to the temporary supply glut, this higher cost has yet to be reflected in gas prices (currently many companies that specialize in gas “fracking” are subsisting on investment capital rather than profits from production, because natural gas prices are not high enough to make production profitable in most instances).
20
Higher-than-forecast depletion rates add to doubts about whether unconventional gas will be a global game-changer, as it is being called by its boosters, or merely an expensive, short-term, marginal addition to supplies of what will soon be a declining source of energy.
21
Can other energy sources replace fossil fuels? Some alternatives, such as wind, are seeing rapid growth rates, but still account for only a minuscule share of current global energy supplies. Even if they maintain high rates of growth, they are unlikely to become primary energy sources in any but a small handful of nations by 2050.
BOX 3.3
Applying Time to Energy Analysis
by Nate Hagens (Excerpted with permission)
Biological organisms, including human societies both with and without market systems, discount distant outputs over those available at the present time based on risks associated with an uncertain future. As the timing of inputs and outputs varies greatly depending on the type of energy, there is a strong case to incorporate time when assessing energy alternatives. For example, the energy output from solar panels or wind power engines, where most investment happens before they begin producing, may need to be assessed differently when compared to most fossil fuel extraction technologies, where a large portion of the energy output comes much sooner, and a larger (relative) portion of inputs is applied during the extraction process, and not upfront. Thus fossil fuels, particularly oil and natural gas, in addition to having energy quality advantages (cost, storability, transportability, etc.) over many renewable technologies, also have a “temporal advantage” after accounting for human behavioral preference for current consumption/return.
In social circumstances where lower discount rates prevail, such as under government mandates and/or in generally more stable societies, longer term energy output becomes more valuable. Less stable societies with higher discount rates will likely handicap longer energy duration investments, as the cost of time will outweigh the value of delayed energy gains. Also in the context of general limits to growth, it is worth noting the evidence that stressed individuals exhibit higher discount rates.
Taking into account time discounting, the EROEI of oil tends to get higher (that is better), while the EROEIs of wind, solar, and corn ethanol tends to get worse. The future energy gain associated with [wind] turbines has decreasing value to users when either (a) the expected lifetime increases or (b) the effective discount rate increases.
27
If one of the limits to growth consists of limits to capital, then energy sources that tie up capital for a disproportionate length of time before yielding an adequate energy return could be problematic.
In 2009, Post Carbon Institute and the International Forum on Globalization undertook a joint study to analyze 18 energy sources (from oil to tidal power) using 10 criteria (scalability, renewability, energy density, energy returned on energy invested, and so on). While I was the lead author of the ensuing report (
Searching for a Miracle: Net Energy Limits and
the Fate of Industrial Societies
), my job was essentially just to synthesize original research and analysis from many energy experts.
22
It was, to my knowledge, the first time so many energy sources had been examined using so many essential criteria. Our conclusion was that there is no credible scenario in which alternative energy sources can entirely make up for fossil fuels as the latter deplete. The overwhelming likelihood is that, by 2100, global society will have
less
energy available for economic purposes, not more.
23
Here are some relevant passages from that report:
A full replacement of energy currently derived from fossil fuels with energy from alternative sources is probably impossible over the short term; it may be unrealistic to expect it even over longer time frames.... [U]nless energy prices drop in an unprecedented and unforeseeable manner, the world’s economy is likely to become increasingly energy-constrained as fossil fuels deplete and are phased out for environmental reasons. It is highly unlikely that the entire world will ever reach an American or even a European level of energy consumption, and even the maintenance of current energy consumption levels will require massive investment.... Fossil fuel supplies will almost surely decline faster than alternatives can be developed to replace them. New sources of energy will in many cases have lower net energy profiles than conventional fossil fuels have historically had, and they will require expensive new infrastructure to overcome problems of intermittency.
24
Some other studies have reached different, more sanguine conclusions. We believe that this is because they failed to take into account some of the key criteria on which we focused, including the amount of energy returned on the energy that’s invested in producing energy (EROEI). Energy sources with a low EROEI cannot be counted as potential primary sources for industrial societies.
25
As a result of this analysis, we believe that the world has reached immediate, non-negotiable energy limits to growth.
26
BOX 3.4
Net Energy
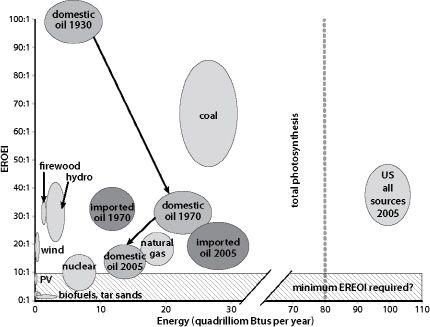
This “balloon graph” of US energy supplies (Figure 25), developed by Charles Hall of the State University of New York at Syracuse, represents the net energy (vertical axis) and quantity used (horizontal axis) of various energy sources at various times. Arrows show the evolution of domestic oil in terms of EROEI and quantity produced (in 1930, 1970, and 2005), illustrating the historic decline of EROEI for US domestic oil. A similar track for imported oil is also shown. The size of each “balloon” represents the uncertainty associated with EROEI estimates. For example, natural gas has an EROEI estimated at between 10:1 and 20:1 and yields nearly 20 quadrillion Btus (or 20 exajoules). “Total photosynthesis” refers to the total amount of solar energy captured annually by all the green plants in the US including forests, food crops, lawns, etc. (note that the US consumed significantly more than this amount in 2005). The total amount of energy consumed in the US in 2005 was about 100 quadrillion Btus, or 100 exajoules; the average EROEI for all energy provided was between 25:1 and 45:1 (with allowance for uncertainty). The shaded area at the bottom of the graph represents the estimated minimum EROEI required to sustain modern industrial society: Charles Hall suggests 5:1 as a minimum, though the figure may well be higher.
28
How Markets May Respond to Resource Scarcity:
The Goldilocks Syndrome
Before examining limits to non-energy resources, it might be helpful to consider how markets respond to resource scarcity, with petroleum as a highly relevant case in point.

FIGURE 25.
Balloon diagram of US energy supplies, including EROEI.

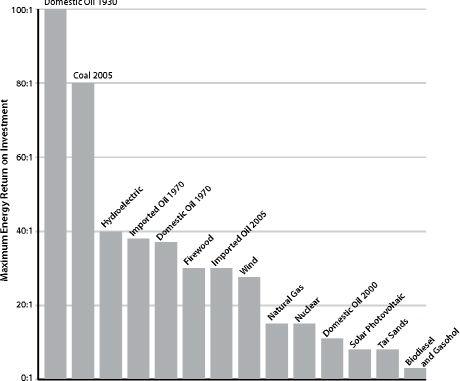
FIGURE 26.
Comparison of EROEI for various energy sources.
Source: Charles Hall, 2010.
The standard economic assumption is that, as a resource becomes scarce, prices will rise until some other resource that can fill the same need becomes cheaper by comparison. What really happens, when there is no ready substitute, can perhaps best be explained with the help of a little recent history and an old children’s story.
Once upon a time (about a dozen years past), oil sold for $20 a barrel in inflation-adjusted figures, and
The Economist
magazine ran a cover story explaining why petroleum prices were set to go much lower.
29
The US Department of Energy and the International Energy Agency were forecasting that, by 2010, oil would probably still be selling for $20 a barrel, but they also considered highly pessimistic scenarios in which the price could rise as high as $30 (those figures are 1996 dollars).
30
Instead, as the new decade wore on, the price of oil soared relentlessly, reaching levels far higher than the “pessimistic” $30 range. Demand for the resource was growing, especially in China and some oil exporting nations like Saudi Arabia; meanwhile, beginning in 2005, actual world oil production hit a plateau. Seeing a perfect opportunity (a necessary commodity with stagnating supply and growing demand), speculators drove the price up even further.
As prices lofted, oil companies and private investors started funding expensive projects to explore for oil in remote and barely accessible places, or to make synthetic liquid fuels out of lower-grade carbon materials like bitumen, coal, or kerogen.
But then in 2008, just as the price of a barrel of oil reached its all-time high of $147, the economies of the OECD countries crashed. Airlines and trucking companies downsized and motorists stayed home. Demand for oil plummeted. So did oil’s price, bottoming out at $32 at the end of 2008.
But with prices this low, investments in hard-to-find oil and hard-to-make substitutes began to look tenuous, so tens of billions of dollars’ worth of new energy projects were canceled or delayed. Yet the industry had been counting on those projects to maintain a steady stream of liquid fuels a few years out, so worries about a future supply crunch began to make headlines.
31
