The End of Growth: Adapting to Our New Economic Reality (22 page)
Read The End of Growth: Adapting to Our New Economic Reality Online
Authors: Richard Heinberg
Tags: #BUS072000

It is the financial returns on their activities that motivate oil companies to make the major investments necessary to find and produce oil. There is a long time lag between investment and return, and so price stability is a necessary condition for further investment.
Here was a conundrum: low prices killed future supply, while high prices killed immediate demand. Only if oil’s price stayed reliably within a narrow — and narrowing — “Goldilocks” band could serious problems be avoided. Prices had to stay not too high, not too low — just right — in order to avert economic mayhem.
32
The gravity of the situation was patently clear
.
Given oil’s pivotal role in the economy, high prices did more than reduce demand, they had helped undermine the economy as a whole in the 1970s and again in 2008. Economist James Hamilton of the University of California, San Diego, has assembled a collection of studies showing a tight correlation between oil price spikes and recessions during the past 50 years. Seeing this correlation, every attentive economist should have forecast a steep recession beginning in 2008, as the oil price soared. “Indeed,” writes Hamilton, “the relation could account for the entire downturn of 2007– 08.... If one could have known in advance what happened to oil prices during 2007–08, and if one had used the historically estimated relation [between oil price spikes and economic impacts]...one would have been able to predict the level of real GDP for both of 2008:Q3 and 2008:Q4 quite accurately.”
33
This is not to ignore the roles of too much debt and the exploding real estate bubble in the ongoing global economic meltdown
.
As we saw in the previous two chapters, the economy was set up to fail regardless of energy prices. But the impact of the collapse of the housing market could only have been amplified by an inability to increase the rate of supply of depleting petroleum. Hamilton again: “At a minimum it is clear that something other than [I would say: “in addition to”] housing deteriorated to turn slow growth into a recession. That something, in my mind, includes the collapse in automobile purchases, slowdown in overall consumption spending, and deteriorating consumer sentiment, in which the oil shock was indisputably a contributing factor.”
Moreover, Hamilton notes that there was “an interaction effect between the oil shock and the problems in housing.” That is, in many metropolitan areas, house prices in 2007 were still rising in the zip codes closest to urban centers but already falling fast in zip codes where commutes were long.
34

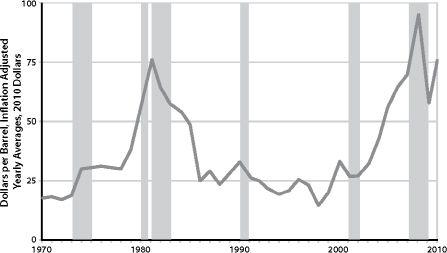
FIGURE 27.
Real Oil Prices and Recessions.
Rising oil prices bring economic instability. Almost every peak in oil price correlates with an economic downturn. Although the 2000 peak in oil price does not correlate with an official recession, it does correlate with the March 2000 collapse of the dot-com bubble, the unofficial start of the early 2000s Recession. Sources: US Energy Information Administration, US Crude Oil First Purchase Price, The National Bureau of Economic Research.
By mid-2009 the oil price had settled within the “Goldilocks” range — not too high (so as to kill the economy and, with it, fuel demand), and not too low (so as to scare away investment in future energy projects and thus reduce supply). That just-right price band appeared to be between $60 and $80 a barrel.
35
How long prices can stay in or near the Goldilocks range is anyone’s guess (as of this writing, oil is trading in New York for over $100 per barrel), but as declines in production in the world’s old super-giant oilfields continue to accelerate and exploration costs continue to mount, the lower boundary of that just-right range will inevitably continue to migrate upward. And while the world economy remains frail, its vulnerability to high energy prices is more pronounced, so that even $80–85 oil could gradually weaken it further, choking off signs of recovery.
36
BOX 3.5
Declining Energy Intensity
Carey King, a research associate in the University of Texas Center for International Energy and Environmental Policy, in a recent paper in Environmental Research Letters, introduced a new measure of energy quality, the Energy Intensity Ratio (EIR).
38
The ratio represents the amount of profit obtained by energy consumers versus energy producers. Higher EIR numbers indicate that more economic value is being derived by households, businesses, and government from each unit of energy consumed.
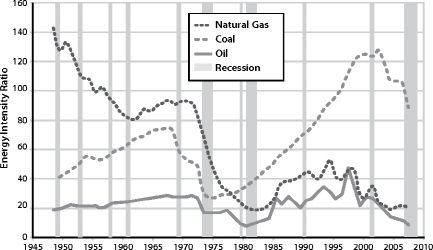
King plots EIR for various fuels every year since World War II. The resulting graphs show two large declines, one before the recessions of the 1970s and early 1980s, and the other during the 2000s, leading up to the current recession. There have been other recessions in the US since World War II, but the longest and deepest were preceded by sustained declines in EIR for all fossil fuels.
King’s analysis suggests that if EIR falls below a certain threshold, the economy ceases growing. For example, in 1972, EIR for gasoline was 5.9 and in 2008 it was 5.5. During times of robust economic growth, such as the 1990s, EIR for gasoline was well over 8.
In other words, oil prices have effectively put a cap on economic recovery.
37
This problem would not exist if the petroleum industry could just get busy and make a lot more oil, so that each unit would be cheaper. But despite its habitual use of the terms “produce” and “production,” the industry doesn’t
make
oil, it merely
extracts
the stuff from finite stores in the Earth’s crust. As we have already seen, the cheap, easy oil is gone. Economic growth is hitting the Peak Oil ceiling.
As we consider other important resources, keep in mind that the same economic phenomenon may play out in these instances as well, though perhaps not as soon or in as dramatic a fashion. Not many resources, when they become scarce, have the capability of choking off economic activity as directly as oil shortages can. But as more and more resources acquire the Goldilocks syndrome, general commodity prices will likely spike and crash repeatedly, making hash of efforts to stabilize the economy.

FIGURE 28.
EIR declines and recessions.
The worst recessions of the last 65 years were preceded by declines in energy quality for oil, natural gas, and coal. Energy quality is plotted using the energy intensity ratio (EIR) for each fuel. Recessions are indicated by gray bars. In layman’s terms, EIR measures how much profit is obtained by energy consumers relative to energy producers. The higher the EIR, the more economic value consumers (including businesses, governments, and people) get from their energy. Credit: Carey King.
BOX 3.6
The Essentials
Energy, water, and food are all essential and have no substitutes, which means that prices fluctuate wildly in response to small changes in quantity (i.e. demand for them is inelastic). As a side effect of this, their contribution to GNP (price × quantity) increases as their supply declines, which is highly perverse. When financial publications tout “bullish” oil or grain prices, the reader may naturally assume that this constitutes good news. But it’s only good for investors in these commodities; for everyone else, higher food and energy prices mean economic pain.
Water
Limits to freshwater could restrict economic growth by impacting society in four primary ways: (1) by increasing mortality and general misery as increasing numbers of people find difficulty filling basic and essential human needs related to drinking, bathing, and cooking; (2) by reducing agricultural output from currently irrigated farmland; (3) by compromising mining and manufacturing processes that require water as an input; and (4) by reducing energy production that requires water. As water becomes scarce, attempts to avert any one of these four impacts will likely make matters worse with regard to at least one of the other three.
There is now widespread concern among experts and responsible agencies that freshwater supplies around the world are being critically overused and degraded, so that water scarcity will increase dramatically as the century wears on. Rivers and streams are being overdrawn, aquifers are being depleted, both surface water and groundwater are being polluted, and sources of flowing surface water — snowpack and glaciers — are receding as a result of climate change.
39
According to the UN’s
Global Environment Outlook 4
(2007), “by 2025, about 1.8 billion people will be living in countries or regions with absolute water scarcity, and two-thirds of the world population could be under conditions of water stress — the threshold for meeting the water requirements for agriculture, industry, domestic purposes, energy and the environment....”
40
A recent study by a team of researchers at the University of Utrecht and the International Groundwater Resources Assessment Center in Utrecht in the Netherlands estimates that groundwater depletion worldwide went from 99.7 million acre-feet (29.5 cubic miles) in 1960 to 229.4 million acre-feet (55 cubic miles) in 2000.
41
When groundwater is withdrawn and used, it ultimately ends up in the world’s oceans, resulting in rising sea levels. However, the contribution of groundwater to sea-level rise will probably diminish in the decades ahead because, in the words of water expert Peter H. Gleick of the Pacific Institute, “as groundwater basins are depleted, there won’t be as much water left to send through rain clouds to the oceans.”
42
In the US, the Colorado River — which supplies water to cities such as Phoenix, Tucson, Los Angeles, Las Vegas, and San Diego, as well as providing most of the irrigation water for the Southwest — could be functionally dry within the decade if current trends continue.
43
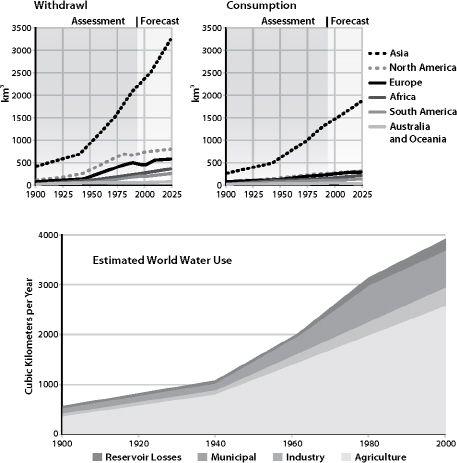
The snowpack in the headwaters of the Colorado River is decreasing due to climate change and is expected to be at 40 percent below normal in the coming years. Meanwhile, withdrawals of water continue to increase as population in the region grows. (It is important to distinguish between water withdrawal and water consumption. Water withdrawal represents the total water taken from a source while water consumption represents the amount of that water withdrawal that is not returned to the source, generally lost to evaporation.)
44
Three billion inhabitants of southern Asia (nearly half the world’s population) face a similar crisis: they depend for their water on the great river systems that flow from the melting glaciers and snow of the Himalayas — the Ganges, Indus, Brahmaputra, Yangtze, Mekong, Salween, Red River (Asia), Xunjiang, Chao Phraya, Irrawaddy, Amu Darya, Syr Darya, Tarim, and Yellow River. Here again, climate change is reducing the amount of snowpack and shrinking ancient glaciers, while growing populations and expanding economies are making ever-increasing demands on these key waterways.
45

