The End of Growth: Adapting to Our New Economic Reality (23 page)
Read The End of Growth: Adapting to Our New Economic Reality Online
Authors: Richard Heinberg
Tags: #BUS072000

FIGURE 29.
World Freshwater Withdrawals and Consumption.
Source: United Nations Environment Program (UNEP).
Life-threatening water shortages have already erupted in parts of Africa. In 2009, Somaliland was gripped by a drought that left thousands of families and their livestock seriously weakened for lack of drinking water. Many water wells dried up altogether, and those that still had water had to serve very large populations, including about 100,000 people displaced by the drought.
46
Agricultural irrigation accounts for 31 percent of freshwater withdrawals in the US, according to the USGS.
47
The impacts of increasing water shortages on agriculture are illustrated by the dilemma of farmers in California’s Central Valley, one of the most productive agricultural areas in America in terms of crop output value per acre. In 2009, in the throes of yet another punishing drought, farmers in Kern County (located in the southern portion of the Central Valley) received less than half their normal water allotment from Federal and state water projects. The local agriculture is highly water-intensive: for Kern County farmers to produce a single orange requires 55 gallons of water, while each peach takes 142 gallons. As a result of the drought, tens of thousands of acres of Kern County farmland were idled.
As snowpack disappears, farmers, ranchers, and cities make up for the loss of running surface water by pumping more from wells. But in many cases this just trades one long-term problem for another: depleting aquifers. The prime example of this trend is the Ogallala aquifer, a vast though shallow underground aquifer located beneath the Great Plains in the United States, which is being drained at an alarming rate. The Ogallala covers an area of approximately 174,000 square miles in portions of eight states (South Dakota, Nebraska, Wyoming, Colorado, Kansas, Oklahoma, New Mexico, and Texas), and supplies water to 27 percent of the irrigated land in the United States.
48
The regions overlying the aquifer are used for ranching and for growing corn, wheat, and soybeans. The Ogallala also provides drinking water to 82 percent of the people who live within the aquifer boundary.
49
Many farmers in the Texas High Plains are already turning away from irrigated agriculture as wells deepen. In most areas covering the aquifer the water table has dropped 10 to 50 feet since groundwater mining began, but drops of over 100 feet have been recorded in several regions.
In the US, only about five percent of freshwater withdrawal is for industrial uses.
50
But these uses support industries that produce, among other things, metals, wood and paper products, chemicals, and gasoline. Industrial water is used for fabricating, processing, washing, diluting, cooling, or transporting products, or for sanitation procedures within manufacturing facilities. Virtually every manufactured product uses water during some part of its production process.
As water becomes scarce, more effort on the part of industry must go toward providing in some other way the same service as cheap water currently provides, almost always at a higher cost. This can mean redesigning industrial processes, or paying more for water brought from further distances.
But moving water takes energy. In California, for example, water pumps use 6.5 percent of the total electricity consumed in the state each year.
51
Desalinating ocean water for industrial, agricultural, and home use also takes energy: the most efficient desalination plants, using reverse osmosis, consume about 2.5 to 3.5 kilowatt hours of energy per cubic meter of fresh water produced.
52
But if more energy must be used to obtain water as water becomes scarce, more water must be used to obtain energy as energy resources become scarce. Let’s return to our earlier example of Kern County, California. In addition to a vital agricultural economy, the county is also host to a $15 billion oil and gas industry — which likewise happens to be very water-intensive. The heavy oil extracted from Kern County oil wells can only flow into and up boreholes when drillers inject enormous amounts of water and steam — 320 gallons for every barrel pumped to the surface. Farmers and oil companies must compete for the same dwindling water supplies.
53
Electricity production requires water, too. About 49 percent of the 410 billion gallons of water the US withdraws daily (if saline water is included) go to cooling thermoelectric power plants, and most of that to cooling coal-burning plants.
54
Nuclear power plants also need substantial amounts of water to cool their reactors. Even the manufacturing of photovoltaic solar panels requires water — in this case, water of exceptionally high purity (though of relatively very small amounts compared to other energy technologies). According to Circle of Blue, a network of journalists and scientists dedicated to water sustainability, “...the competition for water at every stage of the mining, processing, production, shipping and use of energy is growing more fierce, more complex and much more difficult to resolve.”
55
Most nations have been getting steadily more productive with water — that is, water use per unit of GDP has been going up. This is largely due to the shift from agricultural to industrial water use, and also to boosts in efficiency. There is much more that could be done in terms of the latter: water productivity in most sectors could easily double, triple, or more.
Still, across the world conflicts over scarce freshwater resources are multiplying and intensifying. There are many potential flashpoints; for example: a coalition of countries led by Ethiopia is currently challenging old agreements that allow Egypt to use more than half of the Nile’s flow. Without the river, all of Egypt would be desert.
56
As users of water, and uses of water, compete for access to dwindling supplies, many nations will find continuing economic growth increasingly put at risk.
By itself, water scarcity is not likely to be an immediate limiting factor for economic growth for the US, at least for the next couple of decades. But it is already a serious problem in many other nations, including much of Africa and most of the Arab world.
57
And water scarcity subtly tightens all the other constraints we are discussing.
Food
In addition to water, people need food for their very existence. Thus food is also essential to economic growth.
Problems with maintenance of far-flung and intensive food production systems played a role in the collapse of previous civilizations, including the Roman Empire.
58
Mesopotamia, the green and lush center of the Sumerian and Babylonian civilizations, was largely turned to desert as a result of soil erosion. The Mayan civilization likewise succumbed to declining food production, according to recent archaeological research.
59
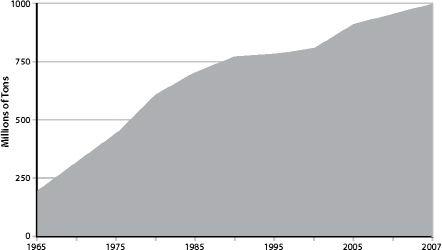
Industrial societies have skirted what would otherwise have been limiting factors to food production using irrigation, new crop varieties, fertilizers, herbicides and pesticides, and mechanization — as well as expanded transport networks that allow local abundance to be shared globally. In terms of productivity, 20th-century agriculture was an unprecedented success: grain production increased an astounding 500 percent (from under 400 million tons in 1900 to nearly two billion in 2000). This achievement mostly depended on the increasing use of cheap and temporarily abundant fossil fuels.
60
At the beginning of the 20th century, most people farmed and agriculture was driven by muscle power (animal and human). Today in most countries, farmers make up a much smaller proportion of the population than was formerly the case and agriculture is at least partly mechanized. Fuel-fed machines plow, plant, harvest, sort, process, and deliver foods, and industrial farmers typically work larger parcels of land. They also typically sell their harvest to a distributor or processor, who then sells packaged food products to a wholesaler, who in turn sells these products to chains of supermarkets or restaurants. The ultimate consumer of food is thus several steps removed from the producer, and food systems in most nations or regions have become dominated by a few giant multinational seed companies, agricultural chemicals corporations, and farm machinery manufacturers, as well as food wholesalers, distributors, and supermarket and fast-food chains.
Farm inputs have also changed. A century ago, farmers saved seeds from year to year, while soil amendments were likely to come from the farm itself in the form of animal manures. Farmers only bought basic implements, plus some useful materials such as lubricants. Today’s industrial farmer relies on an array of packaged products (seeds, fertilizers, pesticides, herbicides, feed, antibiotics), as well as fuels, powered machines, and spare parts. The annual cash outlays for these can be daunting, requiring farmers to take out substantial loans.

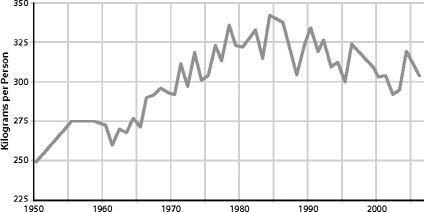
FIGURE 30.
World Grain Production Per Person, 1950–2006.
Since peaking in 1984, world grain production per person has been falling. Source: Earth Policy Institute.

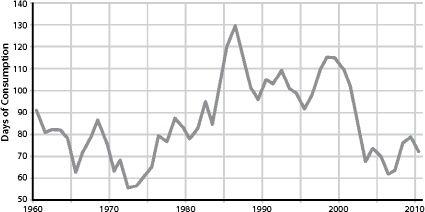
FIGURE 31.
World Grain Stocks, 1960–2010.
After peaking in 1986, world stocks have also been declining. Source: Earth Policy Institute.
The path to our current food abundance was littered with incidental costs, most borne by the environment. Agriculture has become the single greatest source of human impact upon the planet as a result of soil salinization, deforestation, loss of habitat and biodiversity, fresh water scarcity, and pesticide pollution of water and soil.
61
Fertilizer use worldwide increased 500 percent from 1960 to 2000, and this contributed to an explosion of “dead zones” in seas and oceans, upsetting a process of nutrient cycling that has existed for billions of years.
62

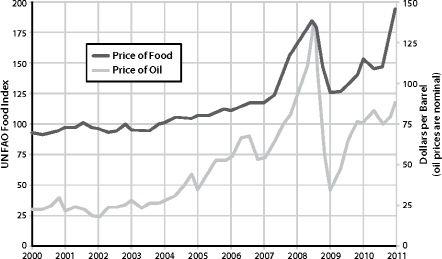
FIGURE 32.
World Food and Oil Prices, 2000–2010.
There is a strong correlation between food and oil prices. When oil prices spiked in the summer of 2008, food prices reached their highest levels since the UN began collecting food price data. In January 2011, food prices jumped again. This time they reached almost 200 on the FAO’s food price index, the highest level ever recorded. Source: UN Food and Agriculture Organization (FAO), US Energy Information Administration.

