Read The Bell Curve: Intelligence and Class Structure in American Life Online
Authors: Richard J. Herrnstein,Charles A. Murray
Tags: #History, #Science, #General, #Psychology, #Sociology, #Genetics & Genomics, #Life Sciences, #Social Science, #Educational Psychology, #Intelligence Levels - United States, #Nature and Nurture, #United States, #Education, #Political Science, #Intelligence Levels - Social Aspects - United States, #Intellect, #Intelligence Levels
The Bell Curve: Intelligence and Class Structure in American Life (59 page)

What of evidence about dysgenesis in the NLSY itself? As of 1990, the women of the NLSY, ages 25 to 33, still had many childbearing years ahead. Presumably the new births will be weighted toward more highly educated women with higher IQs. Therefore the current mean IQ of the
mothers of the NLSY children will rise. Currently, however, it stands at less than 96.
37
Population growth depends not just on the total number of children women have but on how old they are when they have them. The effect is dysgenic when a low-IQ group has babies at a younger age than a high-IQ group, even if the total number of children born in each group eventually is the same. Because this conclusion may not be intuitively obvious, think of a simplified example. Suppose that over several generations Group A and Group B average exactly the same number of children, but all the women in Group A always have their babies on their twentieth birthday and all the women in Group B have their children on their thirtieth birthday. The women in group A will produce three generations of children to every two produced by Group B. Something like this has been happening in the United States, as women of lower intelligence have babies younger than women of higher intelligence. The NLSY once again becomes the best source, because it provides age and education along with IQ scores.
The oldest women in the NLSY had reached the age of 33 in 1990, by which time the great majority of first births have taken place.
38
We can thus get a good idea of how age at first birth or average age at all births varies with cognitive ability, recognizing that a small minority of women, mostly highly educated and at the upper portion of the IQ distribution, will eventually nudge those results slightly.
39
We will not try to compensate for these missing data, because the brunt of our argument is that the timing of births has a dysgenic effect. The biases in the data, reported in the table below for women who were 30 or older, tend to
understate
the true magnitude of age differences by IQ.
40
The average age at first birth was a few months past the 23d birthday. This varied widely, however, by cognitive class. Combining all the ethnic groups in the NLSY, women in the bottom 5 percent of intelligence have their first baby more than seven years younger than women in the top 5 percent. When these figures are computed for the average age for all births (not just the first birth, as in the table), women in the bottom 5 percent have their babies (or all of the ones they have had by their early thirties) at an average of five and a half years earlier. This gap will grow, not shrink, as the NLSY women complete their childbearing
years. Even using the current figures, women in the bottom 5 percent of the IQ distribution will have about five generations for every four generations of the top 5 percent. A large and often ignored dysgenic pressure from differences in age at birth is at work.
| Age at Childbearing | |
|---|---|
| Cognitive Class | Mean Age at First Birth |
| I Very bright | 27.2 |
| II Bright | 25.5 |
| III Normal | 23.4 |
| IV Dull | 21.0 |
| V Very dull | 19.8 |
| Overall average | 23.1 |
Whatever the ethnic differences in cognitive ability are now, they may change if ethnic groups differ in the extent to which their fertilities are dysgenic or not. In the long run, the vector of demographic trends in intelligence—converging or diverging across ethnic groups—could profoundly affect America’s future.
In the 1992 analysis of American fertility using the Current Population Survey (CPS) to which we referred for a national estimate of dysgenesis, women ages 35 to 44 had given birth to an average of 1.94 children: 1.89 for white women, 2.23 for black women, and 2.47 for Latino women.
41
Similar or larger ethnic differences have characterized fertility data for as long as such data have been available, and they have led to a widespread belief that something in black and Latino culture leads them to have larger numbers of children than whites do. We do not dispute that culture can influence family size—the Catholic tradition among Latinos may foster high overall birth rates, for example—but the trends for the three groups are similar once the role of educational level is held constant. Consider the figure below, based on the 1992 CPS study of fertility, again using women in the 35 to 44 age group who have nearly completed their childbearing years.
This figure represents almost total lifetime fertilities, and it tells a simple story. In all three groups of women, more education means lower
fertility. The two minority groups have higher overall fertility, but not by much when education is taken into account. Given the known relationship between IQ and educational attainment, fertility is also falling with rising IQ for each ethnic group. Indeed, if one tries to look into this relationship by assigning IQ equivalents based on the relationship of educational attainment and cognitive ability in the NLSY, it appears that after equating for IQ, black women at a given IQ level may have lower fertility rates than either white or Latino women.
42
Fertility falls as educational level rises in similar fashion for black, white, and Latino women
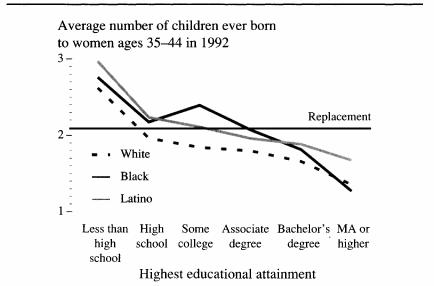
Source:
Bachu 1993, Table 2.
May we then conclude that whites, blacks, and Latinos are on a downhill slope together, neither converging nor diverging in IQ? No, for two reasons. The first is that each ethnic group has different proportions of women at different IQ levels. For example, black women with IQs of 90 and below probably have a fertility rate no higher than that of white women with the same IQs. But even so, only 15 percent of white women in the NLSY fall in the 90-and-below range, compared with 52 percent of black women. The relatively higher fertility rates of women with low IQs therefore have a larger impact on the black population as a whole than on the white. Even if two ethnic groups have
equal birth
rates
at a given IQ, one group may have a larger
proportion
of its babies than the other at that IQ. This is illustrated by the next table, which uses the NLSY to see what the next generation looks like so far, when the women of the NLSY had reached the ages of 25 to 33.
| The Next Generation So Far, for Three Ethnic Groups in the NLSY | ||
|---|---|---|
| | As of 1990, the Percentage of Children Born to Women with: | |
| | IQs Less than 90 | IQs Higher than 110 |
| Whites | 19 | 22 |
| Blacks | 69 | 2 |
| Latinos | 64 | 2 |
| National population | 33 | 15 |
Deciding whether the discrepancy between whites and both blacks and Latinos implies an increasing gap in cognitive ability would require extensive modeling involving many assumptions. On the face of it, the discrepancies are so dramatically large that the probability of further divergence seems substantial. Furthermore, insofar as whites have the highest proportion of college-educated women who are delaying childbirth, the gap between whites and the other minorities is more likely to increase than to diminish as the NLSY women complete their childbearing years.
The ages of the women in the NLSY ranged from 25 to 33 as of our last observation of them, meaning that more children remain to be born, a disproportionate number of whom will be born to women at the higher levels of cognitive ability. This prevented us from using the NLSY to make any estimate of the overall dysgenic effect. But the remaining childbearing years are less of a problem when comparing differentials among ethnic groups. The evidence suggests that better-educated women of all ethnic groups postpone childbearing, to similar degrees.
43
Based on this experience, the differentials as they exist among ethnic groups in the 25-33 age cohort will probably remain about the same through the rest of the NLSY women’s childbearing years, though the means for each group will probably rise somewhat. Insofar as an artifact exists, it presumably acts to understate the eventual mean for whites, since whites have the largest proportion of women with college and advanced degrees, and therefore presumably the largest group of high-IQ women delaying childbirth.
The second potential source of divergence between ethnic groups lies in the ages at which women are having their children. For NLSY mothers, the average ages when they gave birth as of 1990 (when they were ages 25 to 33) were 24-3 for whites, 23.2 for Latinos, and 22.3 for blacks. Once again, these gaps may be expected to increase as the NLSY women complete their childbearing years. If these age differentials persist over time (and they have been found for as long as the statistics for the different groups have been available), they will produce increasing divergence in the mean cognitive ability of successive generations for the three groups. Evidence from other sources confirms the NLSY, finding an increasing gap between white and nonwhite (primarily black) women in when their reproductive lives begin, and also in their likelihood of remaining childless.
44
As we leave this topic, we may see how these various forces have played out so far in the successive generations of the NLSY. The NLSY has been testing the children of its original subjects, which should eventually provide one of the cleanest estimates of dysgenic trends within ethnic groups. The version of an IQ measure that the NLSY uses is the Peabody Picture Vocabulary Test (PPVT), a highly reliable,
g-
loaded test that does not require that the child be able to read. It was normed in 1979 with a national sample of 4,200 children to a mean of 100 and a standard deviation of 15.
If we take the NLSY results at face value, American intelligence is plunging. The mean of the entire sample of NLSY children tested in 1986 and 1988 is only 92, more than half a standard deviation below the national mean. We cannot take these results at face value, however. The NLSY’s sampling weights make the results “representative of the children of a nationally representative sample of women” who were of certain age ranges in the years the tests were given—which is subtly but importantly different from being a representative sample of American children.
45
But although it is not possible to interpret the overall children’s mean with any confidence, it is possible to compare the children
of women in different ethnic groups. The results for children at least six years old and their mothers, shown in the table below, indicate that the gap between the children is larger than the gap separating the mothers, by more than 4 points in the case of blacks and whites, by almost two points in the case of whites and Latinos. There are technical reasons to hedge on any more specific interpretation of these data.
46
We may at least say that the results point in a worrisome direction.
| Ethnic Differences in Test Scores in Two Generations | ||
|---|---|---|
| Ethnic Comparison | Gap Separating the Mothers in IQ Points | Gap Separating the Children in IQ Points |
| White-black | 13.2 | 17.5 |
| White-Latino | 12.2 | 14.1 |
Pulling these different views of the situation together, the data reveal demographic pressures for further ethnic divergence in IQ. We will not hazard a guess about the magnitude of ethnic divergence or its speed. Within another decade, assuming that the NLSY continues its testing program, guesses will not be necessary. When large numbers of the NLSY women approach the end of their childbearing years and their children have been tested after reaching an age when IQ scores are stable, we not only will be able to answer whether and how much ethnic groups diverged for that generation of Americans but be able to pin down answers to many of the other questions about dysgenic effects nationwide.
Immigration is an even older American trip wire for impassioned debate than differential fertility, and the disputes continue to the present day.
49
The reason is not hard to find: America has more people flowing into it than any other country. About half of the world’s migrants resettling in new countries are coming to America as we write.
50
The people already living here have always viewed this influx of newcomers with complicated reactions ranging from pride to alarm. John Higham and others have traced the crests and troughs of nativism and xenophobia, often laced with open racism, in our history.
51
