Read The Bell Curve: Intelligence and Class Structure in American Life Online
Authors: Richard J. Herrnstein,Charles A. Murray
Tags: #History, #Science, #General, #Psychology, #Sociology, #Genetics & Genomics, #Life Sciences, #Social Science, #Educational Psychology, #Intelligence Levels - United States, #Nature and Nurture, #United States, #Education, #Political Science, #Intelligence Levels - Social Aspects - United States, #Intellect, #Intelligence Levels
The Bell Curve: Intelligence and Class Structure in American Life (63 page)

Sixty-two percent of men ever interviewed in jail or prison came from the bottom 20 percent of intelligence

We start with women who have ever received welfare. The data are shown in the figure below. Overall, the mean IQ of women who ever received welfare was 89. About 85 percent of them were below average in IQ, and fewer than 4 percent had IQs in the top two deciles.
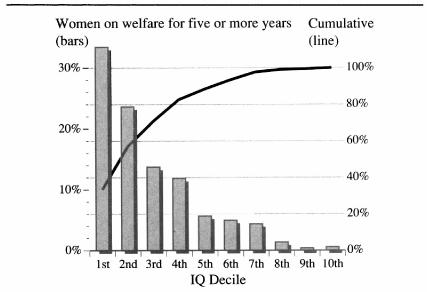
For chronic welfare recipients, defined as women who had received welfare for at least five years by 1990, the cognitive distribution was even lower.
1
As the figure shows , 57 percent of chronic welfare mothers were in the bottom two deciles of IQ, 88 percent were in the bottom half of the distribution, and their mean IQ was 86. Just as low IQ was increasingly prevalent as the level of male unemployment increased, so also is low IQ more prevalent among mothers as their dependency on welfare rises.
Forty-five percent of women who ever received welfare are in the bottom 20 percent of intelligence

Fifty-seven percent of chronic welfare recipients are in the bottom 20 percent of intelligence
In this section, we describe the prevalence of low IQ among the mothers of children with various problems. That is, we are presenting an answer to the question, “If I am trying to deal with a certain problem regarding the children of young adults, what can I assume about the intelligence of their mothers?”
We begin with the overriding fact that, as of 1990, the NLSY mothers as a group were markedly below average in IQ. Their mean IQ was 95.7. Fourteen percent of NLSY children were born to mothers in the bottom decile of IQ; 27 percent: to mothers in the bottom two deciles; 62 percent to mothers in the bottom half of the distribution. Thus, for example, a problem involving NLSY children will “ordinarily” show that 62 percent of the children have mothers with below-average IQ. As will be clear, the observed proportions of low-IQ mothers are often considerably elevated above that expectation.
2
But these benchmark figures must be kept in mind when interpreting all the analyses involving children.
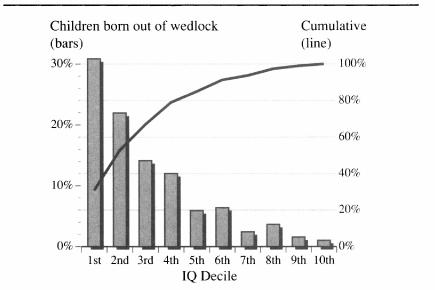
We start with the children who are born to unmarried women (see the
figure
below). The mean IQ of mothers of children born out of wedlock was 87.
3
Of all illegitimate children in the NLSY sample, almost one out of three was born to a mother in the bottom 10 percent of the intelligence distribution, with an IQ under 81, and 85 percent were born to women in the bottom half of the cognitive ability distribution.
Fifty-two percent of illegitimate children were born to mothers in the bottom 20 percent of intelligence
Restricting the analysis to those children who are most at risk, these percentages, already extreme, become even more bunched at the lower end of the distribution. Consider children who fit the archetype of the child at risk: born to a poor, single, teenage girl (with poverty measured in the year prior to giving birth). Almost two out of three (64 percent) of such children were born to women in the bottom 20 percent of the cognitive ability distribution. Ninety-five percent of them were born to women in the bottom half.
The figure below shows the proportion of NLSY children born to a married couple but living (in 1990) with just their mothers because of divorce or separation. First, a caution: The profile we are about to present may change in the future because so many of the expected divorces among the NLSY sample have not yet occurred. For women who had ever been married in the 25 to 33 age range as of 1990, we may, however, ask: Among their children who were living in mother-only families as of 1990, what is the distribution of the mother’s intelligence?
Thirty-one percent of children living with divorced or separated mothers had mothers with IQs in the bottom 20 percent of intelligence

Divorced and separated mothers averaged an IQ of 93.
4
More than half of all children living with their divorced or separated mothers in the NLSY were born to women in the bottom 30 percent of the IQ distribution. Seventy-six percent were born to women in the bottom half of the distribution. Remember that there is no confounding with illegitimacy; all children born out of wedlock are excluded from this sample. The prevailing notion that separation and divorce are so endemic that they affect everyone more or less equally is wrong as regards cognitive ability, at least in this age group.
Perhaps the differences will even out to some extent in the long run. Brighter women get married and have their children later. In the NLSY sample, their marriages have had less time to break up than those for women lower in the distribution. Only time will tell whether and how much the distribution in the graph above will change in the years to come. At this point, the skew is notable and clear.
Pulling together the data on illegitimacy and other forms of single parenthood, here are a few key points:
- Within the bottom two deciles of intelligence, illegitimacy is more common than divorce or separation as the source of single parenthood.
- Beginning with the third decile, divorce and separation become an equal or predominant source of single parenthood.
- The bottom half of the cognitive ability distribution accounts for 82 percent of all children in single-parent homes (combining illegitimacy with divorce or separation) as of 1990.
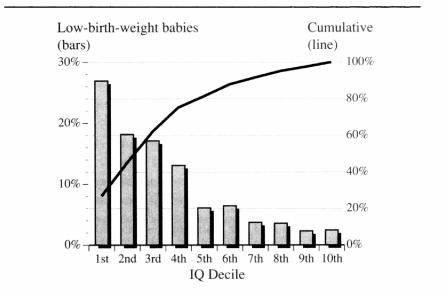
Among whites, the chances of having a low-birth-weight baby were associated with IQ, not socioeconomic background, when both variables were taken into account (Chapter 10). The prevalence of low-birth-weight babies among women in the bottom half of the distribution persists when the entire NLSY sample is considered (the
figure
below).
Mothers with low-birth-weight babies averaged an IQ of 89. Almost three out of four (74 percent) mothers were in the bottom half of the IQ distribution.
Forty-five percent of low-birth-weight babies had mothers in the bottom 20 percent of intelligence
Chapter 10 discussed the HOME inventory, a measure combining many indicators of both emotional support (for example, disciplinary style) and cognitive stimulation (for example, reading to the child). Here, we examine children whose HOME scores put them in the bottom 10 percent of environments (using national norms for the HOME inventory).
The mean IQ of mothers of children in the worst home environments was 86. Three out of eight had IQs below 81; 86 percent had IQs below 100. The figure below combines the results for children in all age groups. There were some age differences, however: Generally, the concentration of the worst environments among mothers with low cognitive ability got worse as the children got older. For children ages 3 to 5 who were in the worst home environments, 59 percent had mothers with IQs in the bottom two deciles. For children 6 and older, the figure was 65 percent.
Fifty-six percent of all children from bottom decile in home environment were born to mothers in the bottom 20 percent of intelligence

