Read The Bell Curve: Intelligence and Class Structure in American Life Online
Authors: Richard J. Herrnstein,Charles A. Murray
Tags: #History, #Science, #General, #Psychology, #Sociology, #Genetics & Genomics, #Life Sciences, #Social Science, #Educational Psychology, #Intelligence Levels - United States, #Nature and Nurture, #United States, #Education, #Political Science, #Intelligence Levels - Social Aspects - United States, #Intellect, #Intelligence Levels
The Bell Curve: Intelligence and Class Structure in American Life (54 page)

Sociologist Linda Gottfredson has examined this question for blacks and whites.
8
If, for example, black and white males were recruited without discrimination into careers as physicians above a cutoff of an IQ of 112 (which she estimates is a fair approximation to the lower bound for the actual population of physicians), the difference in the qualifying population pools would place the black-white ratio at about .05—about one black doctor for every twenty white ones. According to census data, the actual per capita ratio of black to white male physicians was about .3 in 1980, which is about six black doctors for every twenty white ones. Another example is secondary school teaching, for which a similar calculation implies one black high school teacher for every ten white ones. The actual per capita ratio in 1980 was instead about six black teachers for every ten white ones. In both examples, there are about six times as many blacks in the occupation as there would be if selection by cognitive ability scores were strictly race blind. Gottfredson made these calculations for occupations spanning most of the range of skilled jobs, from physician and engineer at the top end to truck driver and meat cutter at the low end. She concluded that blacks are overrepresented in almost every occupation, but most of all for the high-status occupations like medicine, engineering, and teaching.
9
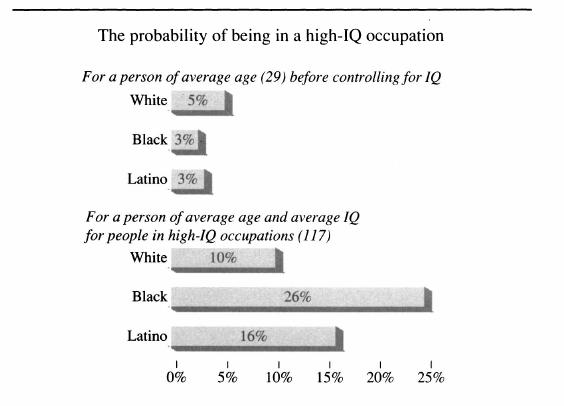
We confirm Gottfredson’s conclusions with data from the NLSY by going back to the high-IQ occupations we discussed in Chapter 2: lawyers, physicians, dentists, engineers, college teachers, accountants, architects, chemists, computer scientists, mathematicians, natural scientists, and social scientists. Grouping all of these occupations together, what chance did whites, blacks, and Latinos in the NLSY have of entering them? The figure below shows the results.
Before controlling for IQ and using unrounded figures, whites were almost twice as likely to be in high-IQ occupations as blacks and more than half again as likely as Latinos.
10
But after controlling for IQ, the picture reverses. The chance of entering a high-IQ occupation for a
black with an IQ of 117 (which was the average IQ of all the people in these occupations in the NLSY sample) was over twice the proportion of whites with the same IQ. Latinos with an IQ of 117 had more than a 50 percent higher chance of entering a high-IQ occupation than whites with the same IQ.
11
This phenomenon applies across a wide range of occupations, as discussed in more detail in Chapter 20.
After controlling for IQ, blacks and Latinos have substantially higher probabilities than whites of being in a high-IQ occupation
We come now to what many people consider the true test of economic equality, dollar income. Two measures of income need to be separated because they speak to different issues.
Wages
provides a direct measure of how much a person gets per unit of time spent on the job.
Annual family income
reflects many other factors as well, being affected by marital status (does the family have two incomes?), nonwage income (from stock dividends to welfare), and the amount of time spent earning wages (did the person have a job for all fifty-two weeks of the year?). We begin with wages, the measure that most directly reflects the current workplace.
As of 1989, white year-round workers (of average age) in the NLSY
sample (men and women) made an average of $6,378 more than blacks and $3,963 more than Latinos.
12
The figure below shows what happens controlling for intelligence, this time presenting the results for a year-round worker with an IQ of 100. The average black who worked year-round was making less than 77 percent of the wage of the average employed white.
13
After controlling for IQ, the average black made 98 percent of the white wage. For Latinos, the ratio after controlling for IQ was also 98 percent of the white wage. Another way to summarize the outcome is that 91 percent of the raw black-white differential in wages and 90 percent of the raw Latino-white differential disappear after controlling for IQ.
After controlling for IQ, ethnic wage differentials shrink from thousands to a few hundred dollars

These results say that only minor earnings differences separate whites, blacks, and Latinos of equal IQ in the NLSY.
14
Because this finding is so far from what the public commentary assumes, we explore it further. We focus on the situation facing blacks, because the black-white disparities have been at the center of the political debate. Parallel analyses for Latinos and whites generally showed smaller initial income disparities and similar patterns of convergence after controlling for IQ.
Our finding that wage differentials nearly disappear may be a surprise especially in light of the familiar conclusion that wage disparities persist even for blacks and whites with the same education. For example, in the 1992 national data collected by the Bureau of the Census, median earnings of year-round, full-time workers in 1992 were $41,005 for white male graduates with a bachelor’s degree and only $31,001 for black males with the same degree.
15
Similar disparities occur all along the educational range. The same pattern is found in the NLSY data. Even after controlling for education, blacks in the NLSY still earned only 80 percent of the white wage, which seems to make a prima facie case for persistent discrimination in the labor market.
Blacks and whites who grow up in similar economic and social circumstances likewise continue to differ in their earning power as adults. This too is true of the NLSY data. Suppose we control for three factors—age, education, and socioeconomic background—that are generally assumed to influence people’s wages. The result is that black wages are still only 84 percent of white wages, again suggesting continuing racial discrimination.
And yet controlling just for IQ, ignoring both education and socioeconomic background, raises the average black wage to 98 percent of the white wage and reduces the dollar gap in annual earnings from wages for year-round workers to less than $600. A similar result is given as the bottom row in the following table, this time extracting as well the effects of different occupational distributions between whites and blacks. The rows above it show what happens when separate wages are computed for different occupational groupings. Black Wages as a Percentage of White Wages, 1989
| Occupation | Controlling Only for Age | Controlling for Age and Education | Controlling for Age, Education, and Parental SES | Controlling Only for Age and IQ |
|---|---|---|---|---|
| Professional/technical | 87 | 92 | 95 | 102 |
| Managers/administrators | 73 | 72 | 74 | 82 |
| Clerical workers | 99 | 97 | 101 | 119 |
| Sales workers | 74 | 74 | 77 | 89 |
| Craft and kindred workers | 81 | 80 | 83 | 96 |
| Transport operatives | 88 | 87 | 90 | 108 |
| Other operatives | 80 | 80 | 84 | 100 |
| Service workers | 92 | 96 | 102 | 119 |
| Unskilled laborers | 67 | 69 | 72 | 84 |
| All employed persons | 80 | 82 | 86 | 98 |
The table contains a number of noteworthy particulars, but the most interesting result, which generalizes to every occupational category, is how little difference education makes. A common complaint about wages is that they are artificially affected by credentialism. If credentials are important, then educational differences between blacks and whites should account for much of their income differences. The table, however, shows that knowing the educational level of blacks and whites does little to explain the difference in their wages. Socioeconomic background also fails to explain much of the wage gaps in one occupation after another. That brings us to the final column, in which IQs are controlled while education and socioeconomic background are left to vary as they will. The black-white income differences in most of the occupations shrink considerably. Altogether, the table says that an IQ score is more important—in most cases, much more important—in explaining black-white wage differences than are education and socioeconomic background for every occupational category in it.
Analyzing the results in detail would require much finer breakdowns than the ones presented in the table. Why is there still a meaningful differential in the managers/administrators category after controlling for IQ? Why do blacks earn a large wage premium over whites of equivalent age and IQ in clerical and service jobs? The explanations could have something to do with ethnic factors, but the varieties of jobs within these categories are so wide that the differentials could reflect nothing more than different ethnic distributions in specific jobs (for example, the managers/administrators category includes jobs as different as a top executive at GM and the shift manager of a McDonalds; the service workers category includes both police and busboys). We will not try to conduct those analyses, though we hope others will. At the level represented in the table, it looks as if the job market rewards blacks and whites of equivalent cognitive ability nearly equally in almost every job category.
Although we do not attempt the many analyses that might enrich this basic conclusion, one other factor—gender—is so obvious that we must mention it. When gender is added to the analysis, the black-white differences narrow by one or two additional percentage points for each of the comparisons. In the case of IQ, this means that the racial difference
disappears altogether. Controlling for age, IQ, and gender (ignoring education and parental SES), the average wage for year-round black workers in the NLSY sample was 101 percent of the average white wage.
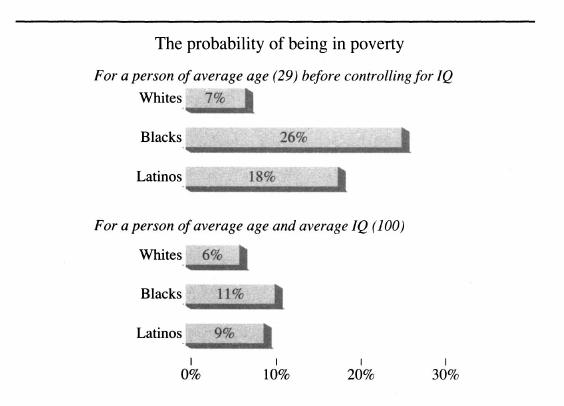
We turn from wages to the broader question of annual family income. The overall family income of a 29-year-old in the NLSY (who was not still in school) was $41,558 for whites, compared to only $29,880 for blacks and $35,514 for Latinos. Controlling for cognitive ability shrinks the black-white difference in family income from $11,678 to $2,793, a notable reduction, but not as large as for the wages discussed above: black family income amounted to 93 percent of white family income after controlling for IQ. Meanwhile, mean Latino family income after controlling for IQ was slightly higher than white income (101 percent of the white mean). The persisting gap in family income between blacks and whites is reflected in the poverty data, as the figure below shows. Controlling for IQ shrinks the difference between whites and other ethnic groups substantially but not completely.
Controlling for IQ cuts the poverty differential by 77 percent for blacks and 74 percent for Latinos