Read The Bell Curve: Intelligence and Class Structure in American Life Online
Authors: Richard J. Herrnstein,Charles A. Murray
Tags: #History, #Science, #General, #Psychology, #Sociology, #Genetics & Genomics, #Life Sciences, #Social Science, #Educational Psychology, #Intelligence Levels - United States, #Nature and Nurture, #United States, #Education, #Political Science, #Intelligence Levels - Social Aspects - United States, #Intellect, #Intelligence Levels
The Bell Curve: Intelligence and Class Structure in American Life (55 page)

If commentators and public policy specialists were looking at a 6 percent poverty rate for whites against 11 percent for blacks—the rates for whites and blacks with IQs of 100 in the lower portion of the graphic—their conclusions might differ from what they are when they see the unadjusted rates of 7 percent and 26 percent in the upper portion. At the least, the ethnic disparities would look less grave. But even after controlling for IQ, the black poverty rate remains almost twice as high as the white rate—still a significant difference.
16
Why does this gap persist, like the gap in total family income, while the gaps in educational attainment, occupations, and wages did not? The search for an answer takes us successively further from the things that IQ can explain into ethnic differences with less well understood roots.
17
Ethnic differences in poverty persist, albeit somewhat reduced, after controlling for IQ. Let us continue with some of the other signs of social maladjustment that Part II assessed for whites alone, adding ethnic differences to the analysis. We will not try to cover each of the indicators in those eight chapters (Appendix 6 provides much of that detail), but it may be instructive to look at a few of the most important ones, seeing where IQ does, and does not, explain what is happening behind the scenes.
Black unemployment has been higher than white unemployment for as long as records have been kept—more than twice as high in 1992, typical of the last twenty years.
18
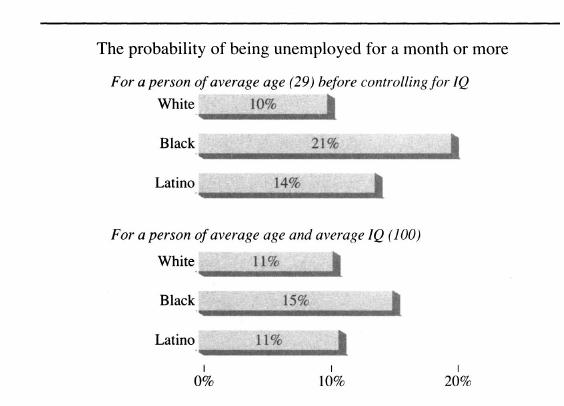
Once again the NLSY tracks with the national statistics. Restricting the analysis to men who were not enrolled in school, 21 percent of blacks spent a month or more unemployed in 1989, more than twice the rate of whites (10 percent). The figure for Latinos was 14 percent. Controlling for cognitive ability reduces these percentages, but differently for blacks and Latinos. The difference between whites and Latinos disappears altogether, as the figure below shows; that between whites and blacks narrows but does not disappear. Black males with an IQ of 100 could expect a 15 percent chance of being unemployed for a month or more as of 1989, compared with an 11 percent chance for whites. Dropping out of the labor force is similarly
related to IQ. Controlling for IQ shrinks the disparity between blacks and whites by 65 percent and the disparity between Latinos and whites by 73 percent.
19
After controlling for IQ, the ethnic discrepancy in male unemployment shrinks by more than half for blacks and disappears for Latinos
Scholars are discussing many possible explanations of the poorer job outcomes for black males, some of which draw on the historical experience of slavery, others on the nature of the urbanizing process following slavery, and still others on the structural shifts in the economy in the 1970s, but ethnic differences in IQ are not often included among the possibilities.
20
Racism and other historical legacies may explain why controlling for IQ does not eliminate differences in unemployment and dropping out of the labor force, but, if so, we would be left with no evident explanation of why such factors are not similarly impeding the equalization of education, occupational selection, or wages, once IQ is taken into account. With the facts in hand, we cannot distinguish between the role of the usual historical factors that people discuss and the possibility of ethnic differences in whatever other personal attributes besides IQ determine a person’s ability to do well in the job market. We do not know whether ethnic groups differ on the average in these other ways, let alone why they do so if they do. But to the extent that there
are such differences, controlling for IQ will not completely wash out the disparities in unemployment and labor force participation. We will not speculate further along these lines here.
Historically, the black-white difference in marriage rates was small until the early 1960s and then widened. By 1991, only 38 percent of black women ages 15 to 44 were married, compared to 58 percent of white women.
21
In using the NLSY, we will limit the analysis to people who had turned 30 by the time of the 1990 interview. Among this group, 78 percent of whites had married before turning 30 compared to only 54 percent of blacks. The white and Latino marriage rates were only a few percentage points apart. When we add cognitive ability to the picture, not much changes. According to the figure below, only 8 percent of the black-white gap disappears after controlling for IQ, leaving a black with an IQ of 100 with a 58 percent chance of having married by his or her thirtieth birthday, compared to a 79 percent chance for a white with the same IQ.
The reasons for this large difference in black and white marriage have been the subject of intense debate that continues as we write. One school of thought argues that structural unemployment has reduced the number of marriageable men for black women, but a growing body of information indicates that neither a shortage of black males nor socioeconomic deprivation explains the bulk of the black-white disparity in marriage.
22
As we have just demonstrated, neither does IQ explain much. For reasons that are yet to be fully understood, black America has taken a markedly different stance toward marriage than white and Latino America.
Controlling for IQ explains little of the large black-white difference in marriage rates

A significant difference between blacks and whites in illegitimate births goes back at least to the early part of this century. As with marriage, however, the ethnic gap has changed in the last three decades. In 1960, 24 percent of black children were illegitimate, compared to only 2 percent of white children—a huge proportional difference. But birth within marriage remained the norm for both races. By 1991, the figures on illegitimate births were 68 percent of all births for blacks compared to 39 percent for Latinos and 18 percent for non-Latino whites.
23
The proportional difference had shrunk, but the widening numerical difference between blacks and whites had led to a situation in which births within marriage were no longer the norm for blacks, while they remained the norm (though a deteriorating one) for whites.
The black-white disparity in the NLSY is consistent with the national statistics (although somewhat lower than the latest figures, because it encompasses births from the mid-1970s to 1990). As of the 1990 interview wave, the probabilities that a child of an NLSY woman would be born out of wedlock (controlling for age) were 62 percent for blacks, 23 percent for Latinos, and 12 percent for non-Latino whites. As far as we are able to determine, this disparity cannot be explained away, no matter what variables are entered into the equation. The figure below shows the usual first step, controlling for cognitive ability.
Controlling for IQ reduced the Latino-white difference by 44 percent but the black-white difference by only 20 percent. Nor does it change much when we add the other factors discussed in Chapter 8: socioeconomic background, poverty, coming from a broken home, or education. No matter how the data are sliced, black women in the NLSY (and in every other representative database that we know of) have a much higher proportion of children out of wedlock than either whites or Latinos. As we write, the debate over the ethnic disparity in illegitimacy
remains as intense and as far from resolution as ever.
24
We can only add that ethnic differences in cognitive ability do not explain much of it either.
Controlling for IQ narrows the Latino-white difference in illegitimacy but leaves a large gap between blacks and whites

As of 1991, about 21 percent of black women ages 15 to 44 were on AFDC nationwide, compared to 12 percent of Latino women and 4 percent of white women (including all women, mothers and nonmothers).
25
The NLSY permits us to ask a related question that extends back through time: How many of the NLSY women, ages 26 to 33 as of 1990, had
ever
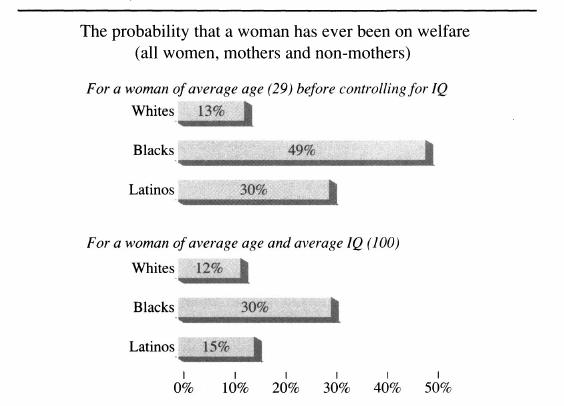
been on welfare? The answer is that 49 percent of black women and 30 percent of all Latino women had been on welfare at one time or another, compared to 13 percent of white women.
26
The figure shows the effects of controlling for IQ.
Adding cognitive ability explains away much of the disparity in welfare recipiency among blacks, whites, and Latinos. In the case of Latinos, where 84 percent of the difference disappears, the remaining disparity with whites is about three percentage points. The disparity between blacks and whites—30 percent of black women receiving welfare,
compared to about 12 percent for whites—is still large but only half as large as the difference not adjusted for IQ.
Controlling for IQ cuts the gap in black-white welfare rates by half and the Latino-white gap by 84 percent
This is as much as we are able to explain away. When we probe further, IQ does not do more to explain the black-white difference. For example, we know that poverty is a crucial factor in determining whether women go on welfare. We therefore explored whether IQ could explain the black-white difference in a particular group of women: those who had had children and had been below the poverty line in the year prior to birth. The results of the analysis are shown in the figure below. Among women who were poor in the year prior to birth, the black-white difference is slightly
larger
after controlling for IQ, not smaller. These data, like those on illegitimacy and marriage, lend support to the suggestion that blacks differ from whites or Latinos in their likelihood of being on welfare for reasons that transcend both poverty and IQ, for reasons that are another subject of continuing debate in the literature.
27
