Read The Bell Curve: Intelligence and Class Structure in American Life Online
Authors: Richard J. Herrnstein,Charles A. Murray
Tags: #History, #Science, #General, #Psychology, #Sociology, #Genetics & Genomics, #Life Sciences, #Social Science, #Educational Psychology, #Intelligence Levels - United States, #Nature and Nurture, #United States, #Education, #Political Science, #Intelligence Levels - Social Aspects - United States, #Intellect, #Intelligence Levels
The Bell Curve: Intelligence and Class Structure in American Life (56 page)

Low birth weight, defined as infants weighing less than 5.5 pounds at birth, is predictive of many subsequent difficulties in the physical, social,
and cognitive development of children. Historically, blacks have had much higher rates of low birth weight than either Latinos or whites. In the most recent reporting year ( 1991 ) for national data, almost fourteen percent of all black babies were low birth weight, compared to five percent of white babies and six percent of Latino babies.
28
In our analyses of the NLSY data, we focus on babies who were low birth weight relative to the length of gestation, excluding premature babies who were less than 5.5 pounds but were appropriate for gestational age using the standard pediatric definition.
29
Using unrounded data, the rate of low-birth-weight births for blacks (10 percent) was 2.9 times as high as for whites. The Latino rate was 1.5 times the white rate. The figure shows what happens after controlling for IQ. The black rate, given an IQ of 100, drops from 10 percent to 6 percent, substantially closing the gap with whites.
30
The Latino-white gap remains effectively unchanged.
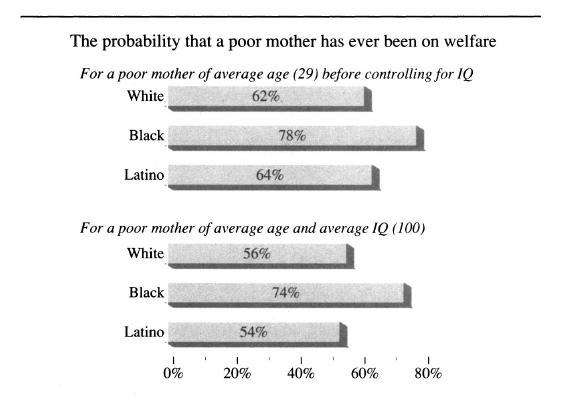
Even among poor mothers, controlling for IQ does not diminish the black-white disparity in welfare recipiency
In 1992, 47 percent of black children under the age of 18 were living under the poverty line. This extraordinarily high figure was nearly as bad for Latino children, with 40 percent under the poverty line. For
non-Latino whites, the proportion was about 14 percent.
31
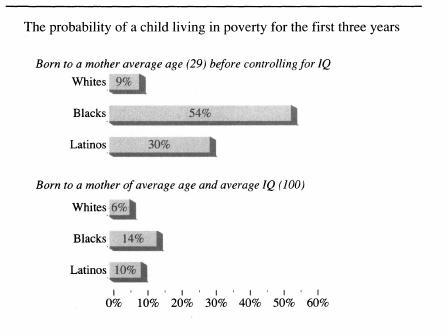
In approaching this issue through the NLSY, we concentrated on very young children, identifying those who had lived in families with incomes below the poverty line throughout their first three years of life. The results, before and after controlling for IQ, are shown in the upper figure on the next page. Given a mother with average IQ and average age, the probability that a black child in the NLSY lived in poverty throughout his first three years was only 14 percent, compared to an uncorrected black average of 54 percent. The reduction for Latinos, from 30 percent to 10 percent, was also large. The proportional difference between minorities and whites remains large.
32
Controlling for IQ cuts the black-white disparity in low-birth-weight babies by half

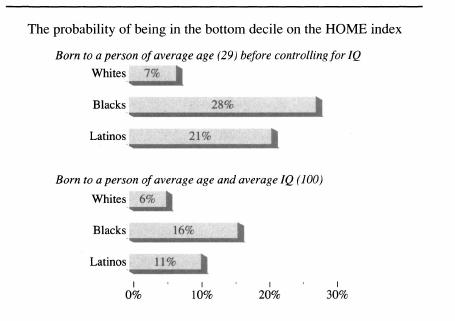
We now turn to the measure of the home environment, the HOME index, described in Chapter 10. For this and the several other indexes used in the assessment of NLSY children, we follow our practice in Chapter 10, focusing on children at the bottom of each scale, with bottom operationally defined as being in the bottom 10 percent.
The disparities in low HOME index scores between whites and minorities were large (see the lower figure on the next page). It was substantially reduced, by 52 percent for blacks and 64 percent for Latinos, but the black rate remained well over twice the white rate and the Latino rate close to twice the white rate.
33
Controlling for IQ reduces the discrepancy between minority and white children living in poverty by more than 80 percent
Controlling for IQ cuts the ethnic disparity in home environments by half for blacks and more than 60 percent for Latinos
Details on the several indexes of child development presented in Chapter 10 may be found in Appendix 6. We summarize them here by showing the proportion of children who showed up in the bottom decile of
any
of the indexes.
As the figure below shows, the ethnic disparities were not great even before controlling for IQ, and they more than disappeared after controlling for IQ. We leave this finding as it stands, but it obviously raises a number of issues. Since these indexes are based primarily on the mothers’ assessments, it is possible that women of different ethnic groups use different reference points (as has been found on ethnic differences in other self-report measures).
34
It is also possible that the results may be taken at face value and that minority children with mothers of similar age and IQ do better on developmental measures than white children, which could have important implications. Filling out this story lies beyond the scope of our work, but we hope it will be taken up by others.
35
Controlling for IQ more than eliminates overall ethnic differences in the developmental indexes

We will discuss this topic in more detail in Chapter 15 as we present the effects of differential fertility across ethnic groups. The figure below shows the children of NLSY mothers who scored in the bottom decile on the Peabody Picture Vocabulary Test (PPVT)
based on national norms,
not the bottom decile of children within the NLSY sample. Controlling for the mother’s IQ reduces ethnic disparities considerably while once again leaving a broad gap with whites—in this case, roughly an equal gap between whites and both blacks and Latinos. The point that stands out, however, is the extremely large proportion of minority NLSY children who were in the bottom decile of the PPVT—in effect, meaning an IQ of 80 or lower—when national norms are applied. This is one of the reasons for concern about fertility that we discuss in Chapter 15.
Based on national norms, high percentages of minority children remain in the bottom decile of IQ after controlling for the mother’s IQ

In the national data, blacks are about 3.8 times more likely to be arrested relative to their numbers in the general population than whites (Latino and non-Latino whites are combined in this comparison).
36
Blacks are also disproportionately the victims of crime, especially violent crime. The ratio of black homicide victims to white as of 1990 was 7.7 to 1 for men and 4.8 to 1 for women.
37
Sociologist Robert Gordon has analyzed black-white differences in crime and concluded that virtually all of the difference in the prevalence of black and white juvenile delinquents is explained by the IQ difference, independent of the effect of socioeconomic status.
38
The only reliable indicator from the NLSY that lets us compare criminal behavior across ethnic groups is the percentage of young men who were ever interviewed while incarcerated.
39
The figure below shows the standard comparison, before and after controlling for cognitive ability. Among white men, the proportion interviewed in a correctional facility after controlling for age was 2.4 percent; among black men, it was 13.1 percent. This large black-white difference was reduced by almost three-quarters when IQ was taken into account. The relationship of cognitive ability to criminal behavior among whites and blacks appears to be similar.
40
As in the case of other indicators, we are left with a nontrivial black-white difference even after controlling for IQ, but the magnitude of the difference shrinks dramatically.
Controlling for IQ cuts the black-white difference in incarceration by almost three-quarters

