Read The Bell Curve: Intelligence and Class Structure in American Life Online
Authors: Richard J. Herrnstein,Charles A. Murray
Tags: #History, #Science, #General, #Psychology, #Sociology, #Genetics & Genomics, #Life Sciences, #Social Science, #Educational Psychology, #Intelligence Levels - United States, #Nature and Nurture, #United States, #Education, #Political Science, #Intelligence Levels - Social Aspects - United States, #Intellect, #Intelligence Levels
The Bell Curve: Intelligence and Class Structure in American Life (26 page)

The usual picture of high school dropouts focuses on their socioeconomic circumstances. It is true that most of them are from poor families, but the relationship of socioeconomics to school dropout is not simple. Among whites, almost no one with an IQ in the top quarter of the distribution fails to get a high school education, no matter how poor their families. Dropout is extremely rare throughout the upper half of the IQ distribution. Socioeconomic background has its most powerful effect at the lowest end of the social spectrum, among students who are already below average in intelligence. Being poor has a small effect on dropping out of school independent of IQ; it has a sizable independent effect on whether a person finishes school with a regular diploma or a high school equivalency certificate.
To raise the chances of getting a college degree, it helps to be in the upper half of the distribution for either IQ or socioeconomic status. But the advantage of a high IQ outweighs that of high status. Similarly, the disadvantage of a low IQ outweighs that of low status. Youngsters from poor backgrounds with high IQs are likely to get through college these days, but those with low IQs, even if they come from well-to-do backgrounds, are not.
O
f all the social behaviors that might be linked to cognitive ability, school dropout prior to high school graduation is the most obvious. Low intelligence is one of the best predictors of school failure, and students who fail a grade or two are likely to have the least attachment to school And yet this relationship, as strong as it is now, is also new.
The very concept of school failure is a modern invention. In the era of the one-room schoolhouse, students advanced at their own pace. There were no formal grade levels, no promotions to the next grade, hence no way to fail.
1
“Dropping out” is an even more recent concept, created by the assumption that it is normal to remain in school through age 17. Until recently, it wasn’t typical. In 1900, the high school diploma was the preserve of a tiny minority of American youth: The number of those who got one amounted to only 6 percent of the crop of potential seniors that year. This figure, known as the
graduation ratio,
is calculated as the percentage of the 17-year-old population.
2
Perhaps even more startling, it was not until the beginning of World War II that the graduation ratio first passed the 50 percent mark. The figure shows the story from 1900 to 1990.
3
The trendlines that overlie the data indicate two broad phases in this ninety-year history. The first phase, from 1908 until the early 1920s, featured moderate expansion of high school education. It did not appear moderate at the time—the graduation rate more than doubled from 1900 to 1922—but the growth was nonetheless moderate by comparison with steep surge from 1922 until the beginning of World War II. This was the opening of the second growth phase, which lasted, with an interruption for World War II, until 1964. The story since 1964 has been mixed. Graduation rates stalled during the last half of the 1960s and then reversed during the 1970s. The trend since 1980 has been uncertainly and shallowly upward. As of 1992, the graduation ratio for 17-year-olds stood at 76 percent, near the 1969 high of 77 percent. The proportion of people who eventually graduate or get a high school equivalency certificate now stands at about 86 percent for the population as a whole.
4
In the first half of the century, the high school diploma becomes the norm
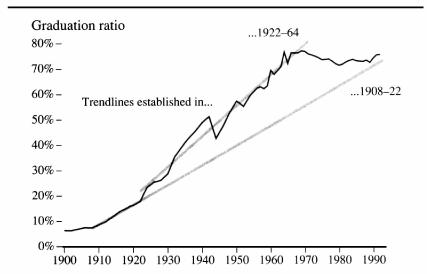
Source: DES
1992, Table 95; U.S. Bureau of the Census, 1975, Table H598-601.
Americans today take it for granted that the goal is to graduate everyone and that a high school dropout rate is a social evil. But earlier thinkers, even those in our liberal tradition, were dubious about educating the entire population beyond the rudiments of literacy. Voltaire’s view that “the lower classes should be guided, not educated,” was typical until this century.
5
Even early in this century, many observers feared that unqualified youngsters were being educated beyond their abilities. “We must turn back the clock,” one prominent educator wrote in 1936, “to take some five million boys and girls from the educational dole.”
6
And yet when the psychometricians sought to document the fear that the country was trying to educate the ineducable, they found little evidence for it. One investigator, Frank Finch, assembled all of the competent studies of the intelligence of high school students conducted from 1916 (the earliest study he could find) to 1942. The mean IQ of ninth graders in these studies was 105; the mean IQ of the twelfth graders or graduates was 107, trivially different.
7
The data suggest that the large number of youngsters who dropped out between ninth grade and high school graduation averaged less than 105 in IQ, but not by much (a calculation explained in the note).
8
Finch found no increasing trend over time in the IQ gap between dropouts and graduates during the early part of the century. Replicating the story that we described regarding the college level in Chapter 1, the first decades of the century saw American high school education mushroom in size without having to dip much deeper into the intellectual pool. This process could not go on forever. As the high school diploma became the norm, the dropouts were likely to become more self-selected for low IQ, and so indeed it transpired.
We have not been able to determine exactly when the gap between nongraduates and graduates began to open up. Probably it was widening even by the early 1940s. By the early 1950s, a study in Iowa found
a ten-point gap in IQ between dropouts and high school graduates.
9
Another study, in 1949, of 2,600 students who had been given an IQ test in the seventh grade, found a gap between the graduates and nongraduates of about thirteen IQ points, close to the IQ’s standard deviation of fifteen.
10
The proportion of students getting a high school diploma had reached about 55 percent by then. By the spring of 1960, when 70 percent of students were graduating, the data from Project TALENT—the large, nationally representative sample of high school students mentioned in Chapter 1—indicate a gap equivalent to almost sixteen IQ points between the academic aptitude of those who graduated and those who did not, slightly more than a standard deviation.
11
This is tantamount to saying that the average dropout had an IQ that put him at the 15th centile of those who graduated.
The situation seems to have remained roughly the same since then. By the standard current definition of the population that “gets a high school education”—meaning either a diploma or by passing an equivalency examination—the NLSY data reveal that the mean score of those who get a high school education is 1.28 standard deviations higher than those who do not. Comparing those who get the ordinary high school diploma with all those who left high school before doing so (including those who later get an equivalency certificate), the gap is 1.02 standard deviations.
Who drops out of high school these days? The following table shows the story for NLSY whites in the various cognitive classes. The results could hardly be starker. Among whites in the top quartile (Classes I and II together), virtually everyone got a high school education. In the bottom quartile of the IQ distribution (Classes IV and V together), 39 percent of whites did not.
12
This huge discrepancy is also predictable, however, given the close relationship between IQ and educational attainment—so predictable that we should pause for a moment before viewing dropout rates with alarm. Is a 39 percent dropout rate for students in the lowest quartile of IQ “high”? From one perspective, it seems so, considering how essential education appears to be for making a living. From another perspective, it is remarkable that over 60 percent of white youths with IQs under 90 did get a high school education. It is particularly remarkable that nearly half of the youths in Class V, with IQs of 75 and under, completed a high school education, despite being on the borderline (or beyond) of the clinical definition of retarded.
13
Whether these figures say something about the ability of low-IQ students to learn or about the state of American secondary education is a topic we defer until Chapter 18.
| Failure to Get a High School Education Among Whites | |
|---|---|
| aThe actual figure was 0.4 percent. | |
| Cognitive Class | Percentage Who Did Not Graduate or Pass a High School Equivalency Exam |
| I Very bright | 0 |
| II Bright | 0a |
| III Normal | 6 |
| IV Dull | 35 |
| V Very dull | 55 |
| Overall average | 9 |
The standard question now arises: To what extent are we looking at an effect of cognitive ability, and to what extent are white children from poor socioeconomic backgrounds being shunted out of the school system because of their backgrounds? The answer depends on exactly how the question is asked. Specifically, it is important to be precise about what “a high school education” means. In the table above, it was defined to include anyone who graduated from high school in the normal way or who passed an equivalency examination, known generically as a GED (for General Educational Development).
14
This has become nearly standard practice when researchers and journalists alike talk about high school dropout. But recent work by economists Steven Cameron and James Heckman has demonstrated that GED youths are not equivalent to “normal” graduates in terms of their success in the job market.
15
In their unemployment rates, job tenure, and wages, the GEDs look more like dropouts than they look like high school graduates, raising the possibility that they differ from other high school graduates in a variety of ways that makes it dangerous to lump all people with “a high school education” into a single group. We know from our own analyses that the white GEDs in the NLSY had an average IQ half a standard deviation lower
than the average for white high school graduates. Furthermore, apart from the specifics of the data, it is apparent that the nature of the GED student’s behavior—giving up on school, then later returning to pass the examination—is different in kind from that of both the dropout who leaves school and never goes back, and from that: of the youth who sticks with four consecutive years of schooling and gets a diploma.
To clinch their case for separating GED from “normal” graduates, Cameron and Heckman also point out that the size of the GED population, once negligible, has grown to become a substantial minority. In 1968, GED graduates accounted for only 5 percent of all high school certifications. By 1980, that proportion had reached more than 13 percent, where it has remained, with minor fluctuations, ever since.
16
We are persuaded that these disparate groups need to be separated and will therefore analyze separately the relationship of IQ arid socioeconomic background to each of these two types of dropouts.
First, we compare students who got a high school degree through the normal process with dropouts who left school never to return, shown in the next figure.
Staying through high school to receive a diploma did not require genius or high-status parents. Dropout rates were extremely low for white students who were of at least average intelligence or socioeconomic background. But dropout rates rose rapidly when those variables fell below average, with the rise being precipitous for students with low IQ.
A closer look at these numbers dispels the stereotype of the high school dropout as the bright but unlucky youngster whose talents are wasted because of economic disadvantage or a school system that cannot hold onto him—the stereotype that people have in mind when they lament the American dropout rate because it is frittering away the nation’s human capital.
17
Among whites, hardly anyone in the NLSY fit that description. Of the whites who dropped out never to return, only three-tenths of 1 percent met a realistic definition of the gifted-but-disadvantaged dropout (top quartile of IQ, bottom quartile of socioeconomic background.) Another eight-tenths of 1 percent were in the top quartile of IQ and the third quartile of the socioeconomic distribution.
Even when we relax the definition to include everyone who is from the top half of the IQ distribution and the bottom half of the socioeconomic distribution—a very loose definition indeed—we are talking about a grand total of only 5.5 percent of the permanent dropouts, or half of 1 percent of American whites in the NLSY.
18
