Read The Bell Curve: Intelligence and Class Structure in American Life Online
Authors: Richard J. Herrnstein,Charles A. Murray
Tags: #History, #Science, #General, #Psychology, #Sociology, #Genetics & Genomics, #Life Sciences, #Social Science, #Educational Psychology, #Intelligence Levels - United States, #Nature and Nurture, #United States, #Education, #Political Science, #Intelligence Levels - Social Aspects - United States, #Intellect, #Intelligence Levels
The Bell Curve: Intelligence and Class Structure in American Life (25 page)

The two lines showing the results for high school graduates are much more informative. These people are taking a homogeneous and modest set of educational skills to the workplace. Within this group, IQ has a strong effect independent of socioeconomic background. A young adult at the bottom 2 percent of IQ had about a 24 percent change of being in poverty compared to less than a 2 percent chance for one at the top 2 percent of IQ (given average age and socioeconomic background, and just a high school diploma). The parents’ background made much less difference. Cognitive ability still has a major effect on poverty even within groups with identical education.
How does the information we have just presented help in trying to understand the nature of poverty in America? To illustrate, consider one of the most painful topics in recent American social policy, the growing proportion of poor who consist of children. As of the 1991 figures, 22 percent of all children under the age of 15 were below the official poverty line, twice as high as the poverty rate among those age 15 and over.
14
It is a scandalously high figure in a country as wealthy as the United States. Presumably every reader wishes for policies that would reduce poverty among children.
Why
are so many children in poverty in a rich country? In political debate, the question is usually glossed over. An impression is conveyed that poverty among children is something that has grown everywhere in the United States, for all kinds of families, for reasons vaguely connected with economic troubles, ungenerous social policies during the 1980s, and discrimination against women and minority groups.
Specialists who have followed these figures know that this explanation is misleading.
15
Poverty among children has always been much higher in families headed by a single woman, whether she is divorced or never married. For families headed by a single woman, the poverty rate in 1991 was 36 percent; for all other American families, 6 percent.
16
Indeed, the national poverty rate for households headed by a single woman has been above 30 percent since official poverty figures began to be available in 1959.
17
The equation is brutally simple: The higher the proportion of children who live in households headed by single women, then, ceteris paribus, the higher the proportion of children who will live in poverty. An important part of the increasing child poverty
in the United States is owed to the increasing proportion of children who live in those families.
18
The political left and right differ in their views of what policies to follow in response to this state of affairs, but recently they have broadly agreed on the joint roles of gender and changes in family structure in pushing up the figures for child poverty.
What does IQ add to this picture? It allows us to focus sharply on who is poor and why, and to dispense with a number of mistaken ideas. To see how, let us consider women, and specifically women with children.
19
Here is the graph that results when we ask how often mothers with differing IQs and differing family structures suffer from poverty. (In the figure, the effects of the mothers’ socioeconomic background are held constant, as are the number of children, which is factored into the calculation of the poverty line.)
The first, glaring point of the figure is that marriage is a powerful poverty preventive, and this is true for women even of modest cognitive ability. A married white woman with children who is markedly below average in cognitive ability—at the 16th centile, say, one standard deviation below the mean—from an average socioeconomic background had only a 10 percent probability of poverty.
The role of the mother’s IQ in determining which white children are poor
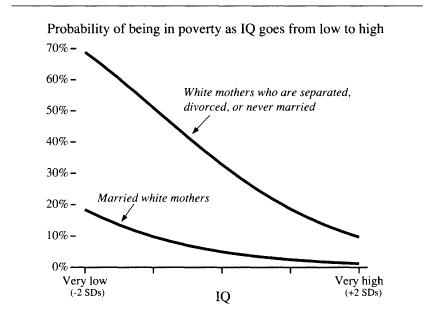
Notes: For computing the plot, age and SES were set at their mean values.
The second point of the graph is that to be without a husband in the house is to run a high risk of poverty, even if the woman was raised in an average socioeconomic background. Such a woman, with even an average IQ, ran a 33 percent chance of being in poverty. If she was unlucky enough to have an IQ of only 85, she had more than a 50 percent chance—five times as high as the risk faced by a married woman of identical IQ and socioeconomic background. Even a woman with a conspicuously high IQ of 130 (two standard deviations above the mean) was predicted to have a poverty rate of 10 percent if she was a single mother, which is quite high compared to white women in general. Perhaps surprisingly, it did not make much difference which of the three kinds of “nonmarriage”—separation, divorce, or no marriage at all—was involved. The results for all three groups of women were drastically different from the results for married women, and quite similar to each other (which is why they are grouped in the figure.)
The third obvious conclusion is that IQ is extremely important in determining poverty among women without a husband present. A poverty rate of 10 percent for women with IQs of 130 may be high compared to some standards, but it is tiny compared to the steeply rising probabilities of poverty that characterize women with below average cognitive ability.
Now we pursue the same issue but in terms of socioeconomic background. Remember that the steep downward curve in the figure above for unmarried mothers is the effect of IQ after holding the effects of socioeconomic status constant. What is the role of socioeconomic background after we take IQ into account? Not much, as the next figure shows.
We used the same scale on the vertical axis in both of the preceding graphs to make the comparison with IQ easier. The conclusion is that no matter how rich and well educated the parents of the mother might have been, a separated, divorced, or never-married white woman with children and an average IQ was still looking at nearly a 30 percent
chance of being below the poverty line, far above the usual level for whites and far above the level facing a woman of average socioeconomic background but superior IQ. We cannot even be sure that higher socioeconomic background reduces the poverty rate at all for unmarried women after the contribution of IQ has been extracted; the downward slope of the line plotted in the graph does not approach statistical significance.
20
The role of the mother’s socioeconomic background in determining which white children are poor
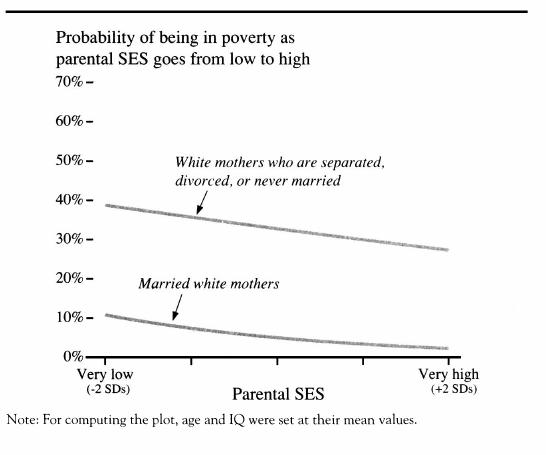
Note: For computing the plot, age and IQ were set at their mean values.
There are few clearer arguments for bringing cognitive ability into the analysis of social problems. Consider the hundreds of articles written about poverty among children and about the effects of single-parent families on poverty. Of course, these are important factors: Children
are
more often poor than adults. Family breakup is responsible for a major portion of the increase in child poverty. But if analysts are trying to understand the high rates of poverty among children, it must be done against the background that whatever other factors increase the risk of poverty among unmarried mothers, they hit unmarried mothers at low
levels of intelligence much harder than they do those at high levels of intelligence—even after socioeconomic background is held constant.
You have been following a common process in social science. An initially simple issue becomes successively more complicated. And we have barely gotten started—an analysis in a technical journal seldom has as few independent variables as the ones we have examined. For that matter, even this simplified analysis represents only the end result of a long process. In the attached note, we describe how big the rest of the iceberg is.
21
Complex analysis has both merits and faults. The merit is that the complications are part of reality. Einstein’s injunction that solutions should be as simple as possible, but no simpler, still applies. At the same time, social science often seems more in need of the inverse injunction, to introduce as much complexity as necessary, but no more. Complications can make us forget what we were trying to understand in the first place. Here is where we believe the situation stands:
By complicating the picture, we raise additional questions: Education is important in affecting poverty; the appropriate next step is to explore how intelligence and socioeconomic status are related to years of education. Marriage is important in determining poverty; we should explore how intelligence and socioeconomic status are related to marriage. These things we shall do in subsequent chapters.
But the simple picture, with only IQ, parental SES, and age in the equation, restricted to our all-white sample, continues to tell a story of its own. A major theme in the public dialogue in the United States has been that socioeconomic disadvantage is the primary driving force behind poverty. The simple picture shows that it just isn’t so for whites.
22
The high rates of poverty that afflict certain segments of the white population are determined more by intelligence than by socioeconomic background. The force and relevance of this statement does not seem to us diminished by the complications it does not embrace.
Indeed, now that we are returning to basics, let us remember something else that could be overlooked in the welter of regression analyses. The poverty rate for whites in Class V was 30 percent—a percentage usually associated with poverty in poor urban neighborhoods. Ethnically
and culturally, these are supposed to be the advantaged Americans: whites of European descent. But they have one big thing working against them: they are not very smart.
Like many other disabilities, low intelligence is not the fault of the individual. Everything we know about the causes of cognitive ability, genetic and environmental, tells us that by the time people grow to an age at which they can be considered responsible moral agents, their IQ is fairly well set. Many readers will find that, before writing another word, we have already made the case for sweeping policy changes meant to rectify what can only be interpreted as a palpably unfair result.
And yet between this and the chapters that will explore those policy issues stretch a few hundred pages of intervening analysis. There is a reason for them. By adding poverty to the portrait of cognitive stratification described in Part I, we hope to have set the terms of a larger problem than income inequality. The issue is not simply how people who are poor through no fault of their own can be made not poor but how we—all of us, of all abilities and income levels—can live together in a society in which all of us can pursue happiness. Changing policy in ways that affect poverty rates may well be part of that solution. But as we observed at the outset of the chapter, poverty itself has been declining as various discontents have been rising during this century, and curing poverty is not necessarily going to do much to cure the other pains that afflict American society. This chapter’s analysis should establish that the traditional socioeconomic analysis of the origins of poverty is inadequate and that intelligence plays a crucial role. We are just at the beginning of understanding how intelligence interacts with the other problems in America’s crisis.
Schooling
Leaving school before getting a high school diploma in the old days was usually not a sign of failure. The youngster had not dropped out but simply moved on. As late as 1940, fewer than half of 18-year-olds got a high school diploma. But in the postwar era, the high school diploma became the norm. Now, not having one is a social disability of some gravity.
