Statistics Essentials For Dummies (32 page)

In general, when hypothesis testing, you set up H
o
and H
a
so that you believe H
o
is true unless your evidence (your data and statistics) show you otherwise. And in that case, where you have sufficient evidence against H
o
, you reject H
o
in favor of H
a
. The burden of proof is on the researcher to show sufficient evidence against H
o
before it's rejected. (That's why H
a
is often called the
research hypothesis
, because H
a
is the hypothesis that the researcher is most interested in showing.) If H
o
is rejected in favor of H
a
, the researcher can say he or she has found a
statistically significant
result; that is, the results refute the previous claim, and something different or new is happening.
Finding sample statistics
After you select your sample, the appropriate number-crunching takes place. Your null hypothesis makes a statement about what the population parameter is (for example, the proportion of all women who have varicose veins or the average miles per gallon of a U.S.-built light truck). You need a measure of how much your results can be expected to change if you took a different sample. In statistical jargon, the data you collect measure that variable of interest, and the statistics that you calculate will include the sample statistic that most closely estimates the population parameter. If you're testing a claim about the proportion of women with varicose veins, you need to calculate the proportion of women in your sample who have varicose veins. If you're testing a claim about the average miles per gallon of a U.S.-built light truck, your statistic should be the average miles per gallon of the light trucks in your sample.
Standardizing the evidence: the test statistic
After you have your sample statistic, you may think you're done with the analysis part and are ready to make your conclusions — but you're not. The problem is you have no way to put your results into any kind of perspective just by looking at them in their regular units. The number of standard errors that a statistic lies above or below the mean is called a
standard score
. To interpret your statistic, you need to convert it from original units to a standard score.
When finding a standard score for a sample mean or proportion, you take your statistic, subtract the mean, and divide the result by the standard error. In the case of hypothesis tests, you use the value in H
o
as the mean. (That's because you assume H
o
is true, unless you have enough evidence against it.) This standardized version of your statistic is called a
test statistic,
and it's the main component of a hypothesis test.
The general procedure for converting a statistic to a test statistic (standard score):
1. Take your statistic minus the claimed value (given by Ho).
2. Divide by the standard error of the statistic (see Chapter 6).
Your test statistic represents the distance between your actual sample results and the claimed population value, in terms of number of standard errors. If you see that the distance between the claim and the sample statistic is small in terms of standard errors, your sample isn't far from the claim and your data are telling you to stick with H
o
. If that distance is large, however, your data are showing less and less support for H
o
. The next question is, how large of a distance is large enough to reject Ho?
Weighing the evidence and making decisions: p-values
To test whether the claim is true, you're looking at your test statistic taken from your sample, and seeing whether it supports the claim. And how do you determine that? By looking at where your test statistic ends up on its corresponding sampling distribution — see Chapter 6. In the case of means or proportions (if certain conditions are met) you look at where your test statistic ends up on the standard normal (Z) distribution. The
Z
-distribution has a mean of 0 and a standard deviation of 1. If your test statistic is close to 0, or at least within that range where most of the results should fall, then you can't reject the claim (H
o
).
If your test statistic is out in the tails of the standard normal distribution, far from 0, it means the results of this sample do not verify the claim, hence we reject H
o
. But how far is "too far from 0"? If the null hypothesis is true, most (about 95%) of the samples will result in test statistics that lie roughly within 2 standard errors of the claim. If H
a
is the not-equal-to alternative, any test statistic outside this range will result in H
o
being rejected (see Figure 8-1).
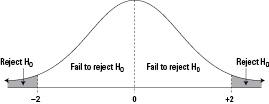
Figure 8-1:
Test statistics and your decision.
If your test statistic is close to 0, you can't reject the claim shown in H
o
. However, this does not mean you accept the claim as truth either. Because H
o
is on trial, and the test statistic is the evidence, either there is enough evidence to reject H
o
or there isn't. In a real trial, the jury's conclusion is either guilty or not guilty. They never conclude "innocent." Similarly, in a hypothesis test we either say "reject H
o
" or "fail to reject H
o
" — we never say "accept H
o
."
Finding the p-value
You can be more specific about your conclusion by noting exactly how far out on the standard normal distribution the test statistic falls, so everyone knows where the result stands and what that means in terms of how strong the evidence is against the claim. In the case of means or proportions (if certain conditions are met), you do this by looking up the test statistic on the standard normal distribution (
Z
-distribution, Table A-1 in the appendix) and finding the probability of being at that value or beyond it (in the same direction). This
p
-value measures how likely it was that you would have gotten your sample results if the null hypothesis were true. The farther out your test statistic is on the tails of the standard normal distribution, the smaller the
p
-value will be, and the more evidence you have against the null hypothesis being true.
To find the
p
-value for your test statistic:
1. Look up the location of your test statistic on the standard normal distribution (see Table A-1 in the appendix).
2. Find the percentage chance of being at or beyond that value in the same direction:
a. If H
a
contains a less-than alternative (left tail), find the probability from Table A-1 in the appendix that corresponds to your test statistic.
b. If H
a
contains a greater-than alternative (right tail), find the probability from Table A-1 in the appendix that corresponds to your test statistic, and then take 1 minus that. (You want the percentage to the right of your test statistic in this case, and percentiles give you the percentage to the left. See Chapter 2.)
3. Double this probability if (and only if) H
a
is the not-equal-to alternative.
This accounts for both the less-than and the greater-than possibilities.
4. Change the probability to a percentage by multiplying by 100 or moving the decimal point two places to the right.
Interpreting a p-value
To make a proper decision about whether or not to reject H
o
, you determine your cutoff probability for your
p
-value before doing a hypothesis test; this cutoff is called an
alpha level
(
α
). Typical values for
α
are 0.05 or 0.01. Here's how to interpret your results for any given alpha level:
If the
p
-value is greater than or equal to
α
, you fail to reject H
o
.
