Statistics Essentials For Dummies (30 page)

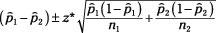
where
and
n
1
are the sample proportion and sample size of the first sample;and
n
2
are the sample proportion and sample size of the second sample; and
z*
is the appropriate value from the standard normal (
Z
-) distribution for your desired confidence level (see Table 7-1 for z
*
-values).
Suppose you work for the Las Vegas Chamber of Commerce and you want to estimate with 95% confidence the difference between the proportion of females versus males who have ever gone to see an Elvis impersonator. Suppose your random sample of 100 females includes 53 females who have seen an Elvis impersonator, so
is 53/100 = 0.53; and your random sample of 110 males includes 37 males who have ever seen an Elvis impersonator, so
is 37/110 = 0.34. Because you want a 95% confidence interval, your
z*
-value is 1.96. Using the formula for the confidence interval for the difference of two proportions, you get the following:
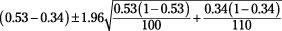

which equals 0.19 plus or minus 0.13.
While performing any calculations involving sample percentages, you must use the decimal form. After the calculations are finished, you may convert to percentages by multiplying by 100.
Your 95% confidence interval for the difference between the percentage of females who have seen an Elvis impersonator and the percentage of males who have seen an Elvis impersonator is 19% plus or minus 13%. The lower end of the interval is 0.19 - 0.13 = 0.06 or 6%; the upper end is 0.19 + 0.13 = 0.32 or 32%. You conclude that a higher percentage of females have seen an Elvis impersonator (compared to males), and the difference is somewhere between 6% and 32%, with a 95% level of confidence. (Note this interval is quite wide; if you increase the sample sizes, the margin of error will decrease because
n
1
and
n
2
are in the denominator of the formula for the margin of error.)
Interpreting Confidence Intervals
The big idea of a confidence interval is that it presents a range of likely values for the population parameter, based on one random sample, with a certain confidence level (such as 95%). This sounds fairly straightforward, but there are some intricacies that can lead to incorrect interpretation of the results. This section helps untangle the confusion that can occur when interpreting a confidence interval.
Consider a survey conducted by the Gallup Organization (a world leader in the survey business). Suppose they sample 1,000 people at random from the United States, and the results show that 520 people (52%) think the president is doing a good job. Gallup reports this survey has a margin of error of plus or minus 3%. So far, you know that a majority of the 1,000 people in this sample approve of the president, but can you say this opinion carries over to a majority of
all
Americans?
If 52% of those sampled approve of the president, you can expect the percentage of all Americans who approve of the president to be 52%, plus or minus 3.0%. That is, a range of likely values is between 52% - 3% = 49% and 52% + 3% = 55%. To report the results from this poll, you would say, "Based on my sample, 52% of all Americans approve of the president, plus or minus a margin of error of 3.0 percent, with a confidence level of 95%."
How does a polling organization report its results? Here's how Gallup does it:
"Based on the total sample of adults in (this) survey, we are 95% confident that the margin of error for our sampling procedure and its results is no more than
±
3.0 percentage points."
Notice that 49% (the lower end of the range of likely values) is less than 50%. So you really can't say that a majority of the American people support the president, based on this sample. You can only say that between 49% and 55% of all Americans support the president.
Now comes the subtle but very important point regarding how to interpret a confidence interval. When one particular confidence interval is calculated, do not include a probability statement about your particular result when you draw your conclusions. That is, it's wrong to say "I am 95% confident that the population mean is between XXX and XXX." Once your sample has been selected and your confidence interval is calculated, it either contains the population parameter or it doesn't; there is no probability involved. Bottom line: The confidence level (in this case 95%) does not apply to a single confidence interval.
