Statistics Essentials For Dummies (14 page)

To use the
Z
-table to find probabilities, do the following:
1. Go to the row that represents the leading digit of your
z
-value and the first digit after the decimal point.
2. Go to the column that represents the second digit after the decimal point of your
z
-value.
3. Intersect the row and column.
That number represents P(
Z
<
z
).
For example, suppose you want to look at P(
Z
< 2.13). Using Table A-1 (appendix), find the row for 2.1 and the column for 0.03. Put 2.1 and 0.03 together as one three-digit number to get 2.13. Intersect that row and column to find the number: 0.9834. You find that P(
Z
< 2.13) = 0.9834.
Finding Probabilities for X
Here are the steps for finding a probability for
X
:
1. Draw a picture of the distribution.
2. Translate the problem into one of the following: P(
X
<
a
), P(
X
>
b
), or P(
a
<
X
<
b
). Shade in the area on your picture.
3. Transform
a
(and/or
b
) into a
z
-value, using the
Z
-formula:.
4. Look up the transformed
z
-value on the
Z
-table (see the preceding section) and find its probability.
5a. If you have a less-than problem, you're done.
5b. If you have a greater-than problem, take one minus the result from Step 4.
5c. If you have a between-values problem, do Steps 1-4 for
b
(the larger of the two values) and then for
a
(the smaller of the two values), and subtract the results.
You need not worry about whether to include an "equal to" in a less-than or greater-than probability because the probability of a continuous random variable equaling one number exactly is zero. (There is no area under the curve at one specific point.)
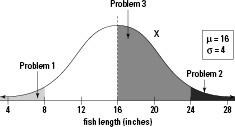
Suppose, for example, that you enter a fishing contest. The contest takes place in a pond where the fish lengths have a normal distribution with mean
= 16 inches and standard deviation
= 4 inches.
Problem 1
: What's the chance of catching a small fish — say, less than 8 inches?
Problem 2
: Suppose a prize is offered for any fish over 24 inches. What's the chance of catching a fish at least that size?
Problem 3
: What's the chance of catching a fish between 16 and 24 inches?
To solve these problems, first draw a picture of the distribution. Figure 5-3 shows a picture of
X
's distribution for fish lengths. You can see where each of the fish lengths mentioned in each of the three fish problems falls.
Figure 5-3:
The distribution of fish lengths in a pond.
Next, translate each problem into probability notation. Problem 1 means find P(
X
< 8). For Problem 2, you want P(
X
> 24). And Problem 3 is asking for
P(16 <
X
< 24).
Step 3 says change the
x
-values to
z
-values using the
Z
-formula,. For Problem 1 of the fish example, you
have
. Similarly for
Problem 2, P(
X
> 24) becomes P(
Z
> 2). Problem 3 translates from P(16 <
X
< 24) to P(0 <
Z
< 2). Figure 5-4 shows a comparison of the
X
-distribution and
Z
-distribution for the values
x
= 8, 16, and 24, which transform into
z
= -2, 0, and +2, respectively.

