Red Capitalism (19 page)
Authors: Carl Walter,Fraser Howie
Tags: #Business & Economics, #Finance, #General

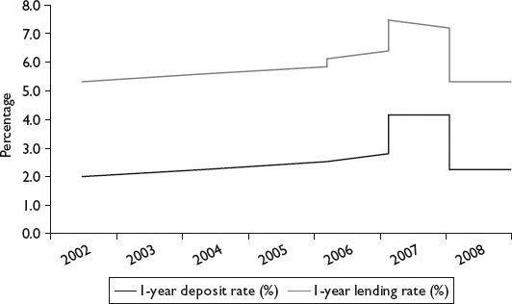
FIGURE 4.4
One-year PBOC RMB bank deposit vs. lending rates, 2002–2008
Source: China Bond
The regulated spread between the cost of funds on deposits and minimum bank lending rates is deliberately set to provide lenders a minimum guaranteed 300 basis point (three percent) profit.
5
When a bank underwrites a bond, therefore, it will, among other things, compare its potential return with that of a loan of a similar maturity to a similar borrower. The issuing company will, of course, consider the same thing. To the extent that this comparison to loan rates influences the underwriting decision, bond pricing does not reliably reference the MOF yield curve. In actual practice, the MOF curve is frequently disregarded and corporate and financial bonds are priced lower than the curve would indicate. This is because banks are motivated by compensation from the issuer via other supplemental businesses. But they also know full well that, as mentioned, the MOF yield curve is a fiction.
Fictional curves from fictional trading
Figure 4.5
shows an actual picture of a single day’s corporate-bond trading on December 8, 2009. The yield curves presented look like something created by random machine-gun bursts against a wall. What the figure represents can be understood by examining the two highlighted AAA transactions, both for bonds with tenors of around five years. As can be seen, the trades were completed at wildly different levels—a low of less than two percent and a high of close to five percent. These are not unique transactions; the chart abounds in such examples. Why was there such a differential between two seemingly similar securities?
FIGURE 4.5
Actual enterprise-bond yield-curve data, by credit rating
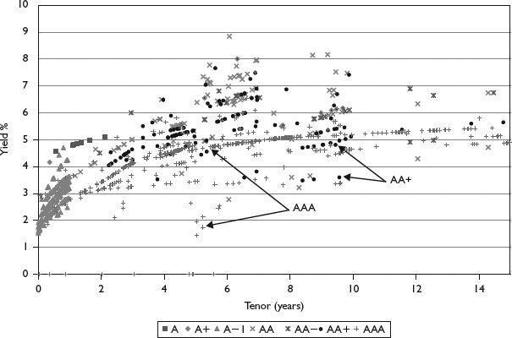
Source: Wind Information, December 7, 2009; excludes MOF, CDB, and financial bonds
The absence of active market trading explains this strange data. On December 8, 2009, for example, the
entire
China inter-bank market for corporate bonds recorded only 1,550 trades—this in a market comprising over 9,000 members and RMB1.3 trillion (US$190 billion) in bond value. In contrast, the US Treasury market each day averages 600,000 trades comprising US$565 billion in value. If market participants do not actively trade, how can the price of a bond be determined and serve as a meaningful measure of value?
The true character of China’s bond market becomes even clearer when the focus is put on only MOF and CDB bond trades, as shown in
Figure 4.6
. On December 7, 2009, the number of trades totaled 52 for MOF bonds and 108 for CDB. These numbers could, in all likelihood, be halved since market-makers create volume (as they are required to do) by, among other actions, selling a bond to a counterparty in the morning and buying it back in the afternoon. With trading volume so light, whatever yield curves that can be drawn are almost arbitrary. How then can the MOF curve be considered a meaningful pricing benchmark for corporate-debt underwriters or, indeed, corporate treasurers?
FIGURE 4.6
MOF and China Development Bank bond trades
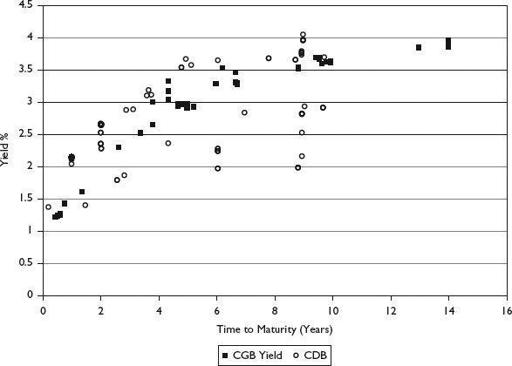
Source: Wind Information, December 8, 2009
Fixing a yield curve
The data raise a question regarding the basic quality of the MOF curve represented in
Figure 4.3
. China uses what are called in the financial industry “daily price fixings” for its debt securities. This means that there is an “official price” set for traded products such as foreign exchange or securities. Usually, this is done by the central bank or market regulator in consultation with a number of market participants and is necessary because the given product did not trade or traded too few times for the market to establish a price.
Official price setting is not an uncommon practice: there are fixings even for such actively traded products as the Japanese yen, as well as such partially convertible currencies as the Indian rupee and, of course, the Chinese renminbi. In China, since October 2007, this official “fixing” for bonds has been done by the China Government Securities Depository Trust and Clearing Corporation, a nominally “independent” entity owned by the PBOC and the depository for all bonds traded in the inter-bank market. Bloomberg carries the China Bond daily fixing table for CGBs and CDB bonds, as illustrated in
Table 4.2
. The
actual
traded price information for each bond traded on that day is also shown.
TABLE 4.2
China Bond price-fixing data, January 4, 2010
Source: Bloomberg, China Bond, and Wind Information. All fixed-rate bonds
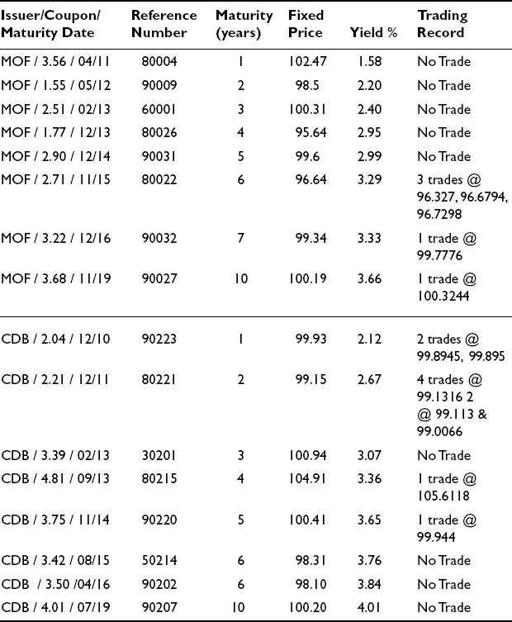
The trading data show that on January 4, 2010, there were a total of 32 CGB trades with a combined value RMB5.57 billion and 55 CDB trades with a combined value of RMB29.53 billion. The actual trades used in the daily fixing table were extracted from this voluminous activity and illustrate precisely why Chinese sovereign yield curves are more fiction than fact. For the one-year to five-year section of the CGB yield curve, not one of these bonds traded, not even once! This official yield curve, built out of nothing but assumptions, did dovetail nicely, however, with the six-, seven- and 10-year bonds, which traded a grand total of five times that day.
Data for the MOF and CDB bonds shown in
Table 4.2
have been charted in
Figure 4.7
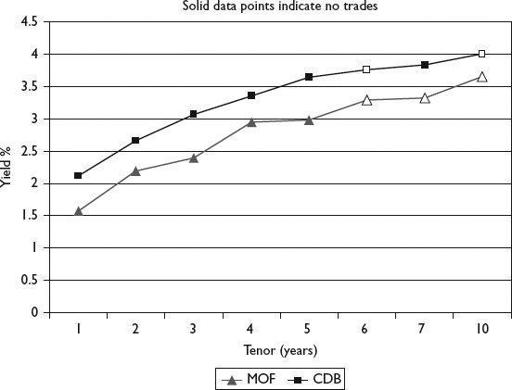
. Together, they describe a smooth, upward-sloping yield curve. Against this background, what reliance should market participants put on CGB yield curves or, in the case of the CDB bonds, to a notional spread over treasuries? It is not surprising, therefore, that the absence of trading for what should be the most liquid products characterizes the market as a whole as well.
FIGURE 4.7
MOF and CDB “fixed” yield curves, January 4, 2010
Source: Wind Information, January 4, 2010
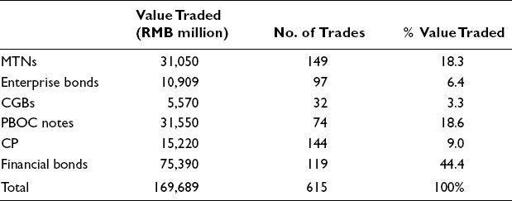
Also on January 4, the entire inter-bank market saw only 615 trades (see
Table 4.3
), among which CGBs incredibly traded the least of all and represented only 3.3 percent of the total value traded. In contrast to the US$25 billion in bond value traded that day in China, the average daily trading volume in the US debt markets is US$565 billion, a figure itself far in excess of the average total daily
global
equity trading of US$420 billion.
6
These US trades result on average in over US$1 trillion in bond value moving between accounts
each day
on the US Federal Reserve Bank’s electronic settlement system.
TABLE 4.3
Inter-bank bond trading summary, January 4, 2010
Source: Wind Information
If the price points, “fixed” or not, on
Figures 4.5
and
4.6
measure anything, it is the liquidity premium paid by investors to sell their bonds into a saturated market. This accounts for the widely scattered price points around faint yield curves. The story is summed up in
Figure 4.8
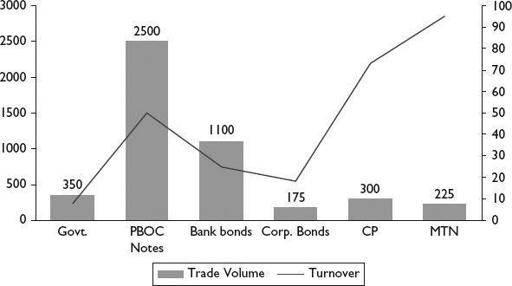
, which illustrates the fundamental illiquidity of CGBs, corporate and financial bonds. In all of 2008, for example, MOF bond turnover was only RMB3.5 trillion or about 10 percent of all outstanding CGBs. The most liquid securities are the shortest in tenor—MTNs, CP and PBOC notes—but even these turned over less than one time during the entire year.
FIGURE 4.8
Inter-bank market trading volume and turnover, FY2008
