Nonplussed! (12 page)
Authors: Julian Havil

Continuing the argument results in the total number of permutations of the
n
objects decomposed in terms of the
N(S
r
)
as

We then have that

and this is a special form of an expression amenable to Binomial Inversion, as described in appendix B.
The statement of this result is that, if two sets of numbers

are related by the condition

then

The result makes the
a
r
rather than the
b
r
the subject of the formula.
In our case, writing
b
n
= n
! and
a
r
= D
r
means that we have our

and so

becomes

This means that

and so


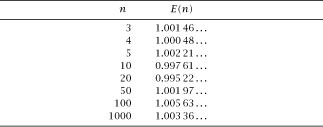
Table 5.2.
The average number of fixed points of permutations.

And so we have a nice result proved in three nice ways, but where is the surprise? We can reveal the first of three by looking at the average (or expected) number of correct allocations of the
n
objects.
The Expected Number of Fixed Points
Suppose that we perform the experiment of matching the initial arrangement
{
1,2,3,
…,n}
with a random permutation of itself a large number of times, and on each occasion note the number of fixed points. Each time this number of fixed points will be one of
{
0,1,2,
…,n}
and we can calculate the average number of them,
E(n)
. It might reasonably be thought that, as
n
increases, this average number increases – but consider
table 5.2
.
The table was constructed for each
n
by finding the average number of fixed points over 1000 random permutations and then averaging this number over 100 repetitions of the process: that average number of fixed points is clinging very tightly to the number 1, independently of the size of
n
. It could be, of course, that the program which was written to generate
table 5.2
is in error, but in fact it isn’t: the theoretical average number of fixed values turns out to be precisely 1 and is independent of
n
. This we prove below.
The expression
E(n)
is the standard notation for the average, or expected value, and in particular of the number of fixed values of permutations of
{
1,2,3,
…,n}
and is defined by the standard expression
