Read The Bell Curve: Intelligence and Class Structure in American Life Online
Authors: Richard J. Herrnstein,Charles A. Murray
Tags: #History, #Science, #General, #Psychology, #Sociology, #Genetics & Genomics, #Life Sciences, #Social Science, #Educational Psychology, #Intelligence Levels - United States, #Nature and Nurture, #United States, #Education, #Political Science, #Intelligence Levels - Social Aspects - United States, #Intellect, #Intelligence Levels
The Bell Curve: Intelligence and Class Structure in American Life (22 page)

“Generally associated with” does not mean “coincident with.” For virtually all of the topics we will be discussing, cognitive ability accounts for only small to middling proportions of the variation among people. It almost always explains less than 20 percent of the variance, to use the statistician’s term, usually less than 10 percent and often less than 5 percent. What this means in English is that you cannot predict what a given person will do from his IQ score—a point that we have made in Part I and will make again, for it needs repeating. On the other hand, despite the low association at the individual level, large differences in social behavior separate groups of people when the groups differ intellectually on the average.
We will argue that intelligence itself, not just its correlation with socioeconomic status, is responsible for these group differences. Our thesis appears to be radical, judging from its neglect by other social scientists. Could low intelligence possibly be a cause of irresponsible childbearing and parenting behaviors, for example? Scholars of childbearing and parenting do not seem to think so. The 850 double-column pages of the authoritative Handbook of Marriage and the Family, for example, allude to intelligence about half a dozen times, always in passing.
1
Could low intelligence possibly be a cause of unemployment
or poverty? Only a scattering of economists have broached the possibility.
2
This neglect points to a gaping hole in the state of knowledge about social behavior. It is not that cognitive ability has been considered and found inconsequential but that it has barely been considered at all The chapters in Part II add cognitive ability to the mix of variables that social scientists have traditionally used, clearing away some of the mystery that has surrounded the nation’s most serious social problems.
We will also argue that cognitive ability is an important factor in thinking about the nature of the present problems, whether or not cognitive ability is a cause. For example, if many of the single women who have babies also have low IQ, it makes no difference (in one sense) whether the low IQ caused them to have the babies or whether the path of causation takes a more winding route. The reality that less intelligent women have most of the out-of-wedlock babies affects and constrains public policy, whatever the path of causation. The simple correlation, unadjusted for other factors—what social scientists called the zero-order correlation—between cognitive ability and social behaviors is socially important.
The chapters of Part II cover a wide range of topics, each requiring extensive documentation. Many statistics, many tables and graphs, many citations to technical journals crowd the pages. But the chapters generally follow a similar pattern, and many of the complexities will be less daunting if you understand three basics: the NLSY, our use of cognitive classes, and our standard operating procedure for statistical analysis.
In Part I, we occasionally made use of the National Longitudinal Survey of Youth, the NLSY. In the chapters that follow, it will play the central role in the analysis, with other studies called in as available and appropriate.
Until a few years ago, there were no answers to many of the questions we will ask, or only very murky answers. No one knew what the relationship of cognitive ability to illegitimacy might be, or even the relationship of cognitive ability to poverty. Despite the millions of mental tests that have been given, very few of the systematic surveys, and sometimes none, gave the analyst a way to conclude with any confidence that
this is how IQ interacts with behavior X for a representative sample of Americans.
Several modern sources of data have begun to answer such questions. The TALENT database, the huge national sample of high school students taken in 1961, is the most venerable of the sources, but its follow-up surveys have been limited in the range and continuity of their data. The Panel Study of Income Dynamics, begun in 1968 and the nation’s longest-running longitudinal database, administered a brief vocabulary test in 1972 to part of its sample, but the scores allow only rough discriminations among people in the lower portions of the distribution of intelligence. The National Longitudinal Survey begun by the Department of Education in 1972 (not to be confused with the NLSY) provides answers to many questions associated with educational outcomes. The department’s more ambitious study, High School and Beyond, conducted in the early 1980s, is also useful.
But the mother lode for scholars who wish to understand the relationship of cognitive ability to social and economic outcomes is the NLSY, whose official name is the National Longitudinal Survey of Labor Market Experience of Youth. When the study began in 1979, the participants in the study were aged 14 to 22.
3
There were originally 12,686 of them, chosen to provide adequate sample sizes for analyzing crucial groups (for example, by oversampling blacks, Latinos, and low-income whites), and also incorporating a weighting system so that analysts could determine the correct estimates for nationally representative samples of their age group. Sample attrition has been kept low and the quality of the data, gathered by the National Opinion Research Council under the supervision of the Center for Human Resources Research at Ohio State University, has been excellent.
The NLSY is unique because it combines in one database all the elements that hitherto had to be studied piecemeal. Only the NLSY combined detailed information on the childhood environment
and
parental socioeconomic status
and
subsequent educational and occupational achievement
and
work history
and
family formation
and—
crucially for our interests—detailed psychometric measures of cognitive skills.
The NLSY acquired its cognitive measures by a lucky coincidence. In 1980, a year after the first wave of data collection, the Department of Defense decided to update the national norms for its battery of enlistment tests. At the time, it was still using test scores from World War II recruits as the reference population. Because the NLSY had just gone
through the technically difficult and tedious task of selecting a nationally representative sample, the Department of Defense proposed to piggyback its study on the NLSY sample.
4
And so the NLSY became the beneficiary of an expensive, well-designed set of cognitive and aptitude tests that were given under carefully controlled conditions to almost 94 percent of the 12,686 young men and women in the NLSY sample.
5
The measure of cognitive ability extracted from this test battery was the Armed Forces Qualification Test, the AFQT. It is what the psychometricians call “highly g-loaded,” meaning that it is a good measure of general cognitive ability.
6
The AFQT’s most significant shortcoming is that it is truncated at the high end; about one person in a thousand gets a perfect score, which means both that the test does not discriminate among the very highest levels of intelligence and that the variance in the population is somewhat understated. Otherwise the AFQT is an excellent test, with psychometric reliability and validity that compare well with those of the other major tests of intelligence. Because the raw scores on the AFQT mean nothing to the average reader, we express them in the IQ metric (with a mean of 100 and a standard deviation of 15) or in centiles. Also, we will subsequently refer to them as “IQ scores,” in keeping with our policy of using
IQ
as a generic term for intelligence test scores. When we use centiles, they are age equated. A centile score of 45, for example, means that the subject would rank in the 45th percentile of everyone born in the same year, if everyone took the AFQT.
7
A final point about the presentation of NLSY results is that
all results are based on weighted analyses,
which means that all may be interpreted in terms of a nationally representative sample of Americans in the NLSY age group. We use data collected through the 1990 interview wave.
To this point, we have been referring to cognitive classes without being specific. In these chapters, we divide the world into cognitive classes—five of them, because that has been the most common number among sociologists who have broken down socioeconomic status into classes and because five allows the natural groupings of “very high,” “high,” “mid,” “low,” and “very low.” We have chosen to break the intervals at the 5th, 25th, 75th, and 95th percentiles of the distribution. The figure shows how this looks for a normally distributed population.
Break points are arbitrary, but we did have some reasons for these.
Mainly, we wanted to focus on the extremes; hence, we avoided a simple breakdown into quintiles (i.e., into equal cuts of 20 percent). A great deal of interest goes on within the top 20 percent and bottom 20 percent of the population. Indeed, if the sample sizes were large enough, we would have defined the top cognitive class as consisting of the top 1 or 2 percent of the population. Important gradations in social behavior occasionally separate the top 2 percent from the next 2 percent. This is in line with another of the themes that we keep reiterating because they are so easily forgotten: You—meaning the self-selected person who has read this far into this book—live in a world that probably looks nothing like the figure. In all likelihood, almost all of your friends and professional associates belong in that top Class I slice. Your friends and associates whom you consider to be unusually slow are probably somewhere in Class II. Those whom you consider to be unusually bright are probably somewhere in the upper fraction of the 99th centile, a very thin slice of the overall distribution. In defining Class I, which we will use as an operational definition of the more amorphous group called the “cognitive elite,” as being the top 5 percent, we are being quite inclusive. It does, after all, embrace some 12 1/2 million people. Class III, the normals, comprises half of the population. Classes II and IV each comprises 20 percent, and Class V, like Class I, comprises 5 percent.
Defining the cognitive classes
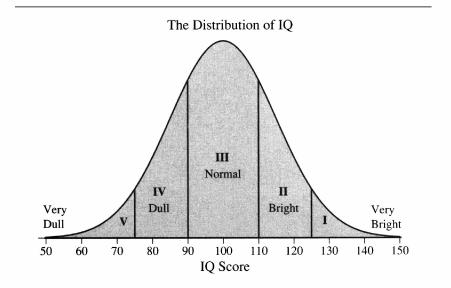
The labels for the classes are the best we could do. It is impossible to devise neutral terms for people in the lowest classes or the highest ones. Our choice of “very dull” for Class V sounds to us less damning than the standard “retarded” (which is generally defined as below an IQ of 70, with “borderline retarded” referring to IQs between 70 and 80). “Very bright” seems more focused than “superior,” which is the standard term for people with IQs of 120 to 130 (those with IQs above 130 are called “very superior” in that nomenclature).
8
The basic tool for multivariate analysis in the social sciences is known as
regression analysis.
9
The many forms of regression analysis have a common structure. There is a result to explain, the
dependent variable.
There are some things that might be the causes, the
independent variables.
Regression analysis tells how much each cause actually affects the result,
taking the role of all the other hypothesized causes into account—
an enormously useful thing for a statistical procedure to do, hence its widespread use.
In most of the chapters of Part II, we will be looking at a variety of social behaviors, ranging from crime to childbearing to unemployment to citizenship. In each instance, we will look first at the direct relationship of cognitive ability to that behavior. After observing a statistical connection, the next question to come to mind is, What else might be another source of the relationship?
In the case of IQ, the obvious answer is socioeconomic status. To what extent is this relationship really founded on the social background and economic resources that shaped the environment in which the person grew up—the parents’ socioeconomic status (SES)—rather than intelligence? Our measure of SES is an index combining indicators of parental education, income, and occupational prestige (details may be found in Appendix 2). Our basic procedure has been to run regression analyses in which the independent variables include IQ and parental SES.
10
The result is a statement of the form: “Here is the relationship of IQ to social behavior X after the effects of socioeconomic background have been extracted,” or vice versa. Usually this takes the analysis most of the distance it can sensibly be pushed. If the independent relationship of IQ to social behavior X is small, there is no point in looking further. If the role of IQ remains large independent of SES, then it is worth thinking about, for it may cast social behavior and public policy in a new light.
What Is a Variable?
The word
variable
confuses some people who are new to statistics, because it sounds as if a variable is something that keeps changing. In fact, it is something that has different values among the members of a population. Consider weight as a variable. For any given observation, weight is a single number: the number of pounds that an object weighed at the time the observation was taken. But over all the members of the sample, weight has different values: It varies, hence it is a variable. A mnemonic for keeping “independent” and “dependent” straight is that the dependent variable is thought to “depend on” the values of the independent variables.
