Read The Bell Curve: Intelligence and Class Structure in American Life Online
Authors: Richard J. Herrnstein,Charles A. Murray
Tags: #History, #Science, #General, #Psychology, #Sociology, #Genetics & Genomics, #Life Sciences, #Social Science, #Educational Psychology, #Intelligence Levels - United States, #Nature and Nurture, #United States, #Education, #Political Science, #Intelligence Levels - Social Aspects - United States, #Intellect, #Intelligence Levels
The Bell Curve: Intelligence and Class Structure in American Life (18 page)

Add to this the phenomenon known as assortative mating. Likes attract when it comes to marriage, and intelligence is one of the most important of
those likes. When this propensity to mate by IQ is combined with increasingly efficient educational and occupational stratification, assortative mating by IQ has more powerful effects on the next generation than it had on the previous one. This process too seems to be getting stronger, part of the brew creating an American class system.
A
s Mae West said in another context, goodness has nothing to do with it. We are not talking about what should have been but what has been. The educational system
does
sort by cognitive ability at the close of the twentieth century in a way that it did not at the opening of the century. The upper strata of intelligence
are
being sucked into a comparatively few occupations in a way that they did not used to be. Cognitive ability
is
importantly related to job productivity. All of these trends will continue under any social policy. We are optimistic enough to believe that no administration, Left or Right, is going to impede the education of the brightest, or forbid the brightest from entering the most cognitively demanding occupations, or find a way to keep employers from rewarding productivity. But we are not so optimistic that we can overlook dark shadows accompanying the trends.
To this point, we have avoided saying what social consequences might be expected. This omission has been deliberate, for part of a candid answer must be, “We aren’t sure.” We can be sure only that the trends are important. Cognitive stratification as a central social process is something genuinely new under the sun. One of our purposes is to bring it to public attention, hopeful that wisdom will come from encouraging more people to think about it.
It is impossible to predict all the ways in which cognitive stratification will interact with the workings of an American democracy that is in flux. We do have some thoughts on the matter, however, and in this chapter use the available scientific data to peer into the future. The data center on the dynamics that will make cognitive stratification more pronounced in the years to come—the differences greater, the overlap smaller, the separation wider. We reserve our larger speculations about the social consequences for Chapters 21 and 22.
The overriding dynamic that will shape the effects of cognitive stratification is the increasing value of intelligence in the marketplace. The smart ones are not only being recruited to college more efficiently, they are not only (on average) more productive in the workplace, their dollar value to employers is increasing and there is every reason to believe that this trend will continue. As it does so, the economic gap separating the upper cognitive classes from the rest of society will increase.
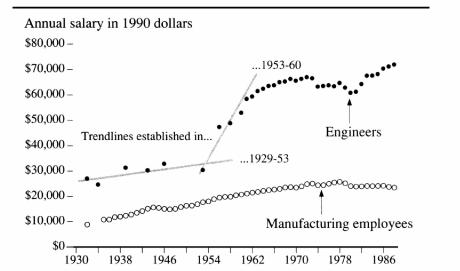
The general shape of what has been happening is shown in the figure for a representative high-IQ occupation, engineering, compared to the average manufacturing employee, starting back in 1932. As always, dollar figures are expressed in 1990 dollars. The 1950s turn out to have been the decade of hidden revolution for income, just as it was for education and status. Throughout the 1930s and 1940s, the average engineer and the average manufacturing employee remained in roughly a constant economic relationship, even converging slightly. Then from 1953 to 1961 the average engineer’s salary nearly doubled while the manufacturing employee’s salary followed the same gradually rising trend and increased by only 20 percent. By the end of the 1980s, the average manufacturing employee had to get by on about $23,000 a year while the engineer made an average of $72,000. The difference in their purchasing power had tripled since the 1940s, which is enough to put them in separate economic brackets.
Engineers’ salaries as an example of how intelligence became much more valuable in the 1950s
Source:
U.S. Bureau of the Census 1975, Tables D802-810, D913-926; Bureau of Labor Statistics 1989, Tables 80, 106.
Were the 1980s Good or Bad for Income?
There are half a dozen different ways to view the economy during the 1980s. Because most of it fell in Ronald Reagan’s presidency, an intense political struggle to characterize the decade as economically “good” or “bad” has ensued. The main source of confusion lies in the distinction between
household income,
which went up for all income groups, driven by the increase in two-income families and low unemployment, and
real wages,
which (generally) rose for white-collar workers and fell for blue-collar workers. There are also confusions that arise because the value of benefit packages rose even though cash wages did not and because of controversies over the proper calculation of changes in real purchasing power. We will not try to adjudicate these issues or the role that President Reagan’s economic policies played, which have taken whole books to argue out.
The comparison between engineers and manufacturing employees is a microcosm of what has happened generally to American workers. Using data from the Current Population Surveys, economists Lawrence Katz and Kevin Murphy, among others, have established that from 1963 to 1987, male workers making the highest 10 percent of wages enjoyed a rise of about 40 percent, while the real wages of those at the corresponding low end were close to static.
1
We opened the chapter by asserting that cognitive ability has been a key factor in this process. Next we look at the reasons for this conclusion.
The standard way of interpreting the figure for engineers and manufacturing is to talk about education. During the last quarter-century, real wages rose more than twice as much for workers with college educations
than for those with high school or less.
2
Trends were not uninterrupted within the interval. Following the huge expansion of the post-World War II college population, it seemed for a while that the economic benefits of education were being swamped by oversupply, as wages fell during the 1970s for college-educated people.
3
But in the 1980s, the trend reversed. Real wages for highly educated people started once again to climb and wages fell for those with twelve or fewer years of schooling.
4
The table below gives the percentage change in real wages for fulltime male workers
5
at three educational levels during the 1980s, broken out by whether they are new workers (one to five or twenty-six to thirty-five years of work experience). The dramatic changes occurred among young men just coming into the labor market. High school graduates and dropouts saw their real wages plunge, while young men with college educations enjoyed a healthy increase.
6
Meanwhile, experienced older men saw little real change in income whatever their level of education. Why the difference between the age groups? Interpretively, wages for men with many years of experience reflect their work history as well as their immediate economic value. Wages for people just entering the labor force are more purely an expression of prevailing market forces. The job market reevaluated schooling during the past two decades: Educated workers, having been devalued in the 1970s, became increasingly valuable in the 1980s, in comparison with less educated workers.
7
| Education, Experience, and Wages, 1979-1987 | |
|---|---|
| Source: Adapted from Katz and Murphy, 1990, Table 1. | |
| | Percentage Change in Wages |
| New workers (1-5 years of experience) | |
| Less than 12 years of school | -15.8 |
| High school degree | -19.8 |
| 16 or more years of school | +10.8 |
| Old workers (26-35 years of experience) | |
| Less than 12 years of school | -1.9 |
| High school degree | -2.8 |
| 16 or more years of school | +1.8 |
Why have the economic returns to education lately risen, thereby widening the income gap between the educated and the uneducated? Perhaps, say some commentators, the wage inequality problem is technological, as machines displace people from low-skill jobs. Perhaps schools are failing to teach people skills that they used to teach, or maybe the schools are doing as well as ever but the blue-collar jobs that require only low-level skills are emigrating to countries where labor is cheaper, thereby creating an oversupply of less educated workers in America. Perhaps the welfare system is eroding the need to work among the low-skill population, or the weakening labor unions are not protecting their economic interests, or a declining real minimum wage is letting the wage structure sag at the low end.
These possibilities all bear on a crucial issue:
How much good would it do to improve education for the people earning low wages?
If somehow the government can cajole or entice youths to stay in school for a few extra years, will their economic disadvantage in the new labor market go away? We doubt it. Their disadvantage might be diminished, but only modestly. There is reason to think that the job market has been rewarding not just education but intelligence.
8
The indispensable database for analyzing wages over time is the Current Population Survey, the monthly national survey conducted by the Bureau of the Census and the Bureau of Labor Statistics, which asks people only about their years of education, not their IQs. But as the sophisticated statistical analyses of wage variation have accumulated, experts have come to agree that something beyond education, gender, and experience has been at work to increase income disparities in recent times.
9
The spread in real wages grew between 1963 and 1987 even after taking those other factors into account.
10
The economic term for this unexplained variation in wages is “the residual.”
11
To understand the growing wage inequality requires an account of this residual variation. Residual wage variation for both men and women started rising in about 1970 and seems still to be rising. Among economists, there is a consensus that, whatever those residual characteristics consist of, it has been mainly the
demand
for them, not their
supply,
that has been changing and causing increasing wage inequality for a generation, with no signs of abating.
12
Despite the public focus on
the increasing importance of education in the workplace, most of the increasing wage inequality during the past two and a half decades is due to changes in the demand for the residual characteristics of workers rather than to changes in the demand for education or experience.
13
The job market for people lacking the residual characteristics declined, while expanding for people having them.
What then is this residual, this X factor, that increasingly commands a wage premium over and above education? It could be a variety of factors. It could be rooted in diligence, ambition, or sociability.
14
It could be associated with different industries or different firms within industries, or different wage norms (e.g., regional variations, variations in merit pay), again insofar as they are not accounted for by the measured variables. Or it could be cognitive ability. Conclusive evidence is hard to come by, but readers will not be surprised to learn that we believe that it includes cognitive ability. There are several lines of support for this hypothesis.
As a first cut at the problem, the changing wages have something to do with the shifting occupational structure of our economy. High-status, and therefore relatively high-paying, jobs are tipped toward people with high intelligence, as Chapter 2 showed. As the high-end jobs have become more numerous, demand must rise for the intellectual abilities that they require. When demand rises for any good, including intelligence, the price (in this case, the wages) goes up. Purely on economic grounds, then, wage inequality grew as the economic demand for intelligence climbed.
We further know from the data discussed in Chapter 3 that cognitive ability affects how well workers at all levels do their jobs. If smarter workers are, on average, better workers, there is reason to believe that income within job categories may be correlated with intelligence.
Still further, we know that the correlation between intelligence and income is not much diminished by partialing out the contributions of education, work experience, marital status, and other demographic variables.
15
Such a finding strengthens the idea that the job market is increasingly rewarding not just education but intelligence.
