Resurrecting Pompeii (23 page)
Read Resurrecting Pompeii Online
Authors: Estelle Lazer

Frequency histogram showing sex attribution based on the ventral arc
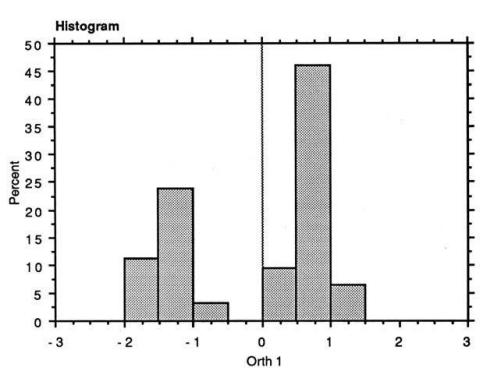 Figure 6.2
Frequency histogram of the factor scores for the first principal component of the pelvic non-metric traits used for the determination of sex
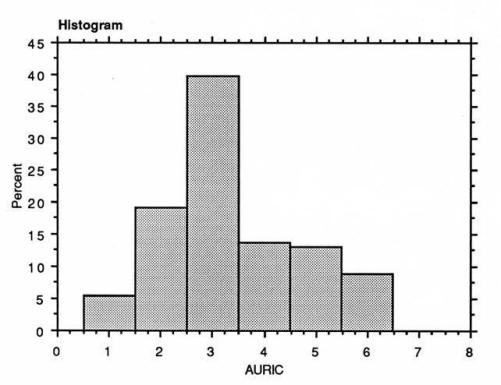 Figure 6.3
Frequency histogram of sex attribution based on the auricular area
39
Another argument that could be put forward to explain the higher frequency of pelves with male attributes is that the sample may be skewed towards the more robust bones. It is difficult to assess this point, though the visualization of the ‘crumble factor’ on the skulls (Chapter 5) suggests that relative robusticity was not a major factor in the survival of adult material.
These factors probably partially explain the high male to female ratio. Nonetheless, there is no compelling evidence to suggest that the number of males to females should have been equivalent and it is extremely unlikely that the pelvic sample contained more females than males, even taking into account the tendency for mid-range female pelves to be misidentified.
Seven measurements were made on just under 100 left humeri from the Forum Bath collection to determine the degree of sexual dimorphism in the humerus in the Pompeian sample.
40
The measurements were made with callipers, tape and an osteometric board according to standard definitions.
41
Left bones were chosen to ensure that each bone represented a single individual. Previous studies of both left and right humeri have demonstrated that there are no apparent side related differences for these measurements.
42
Dittrick and Suchey
43
found from discriminant function analyses of nine humeral measurements that multiple variables did not produce appreciably better results over the use of several of the best variables used singly.
In theory, the expected sex differences should be a re flection of the greater size and robusticity of males. Some of the measurements were employed because they have traditionally been considered good sex indicators.
44
The rest of the measurements were chosen on the basis of metric studies of sexual dimorphism from the humerus.
45
It has been claimed that, as for sex determination from the femur, several humeral measurements, analyzed singly, are more reliable sex indicators than cranial variables.
46
It has been found that proximal, or upper humerus measurements, generally provide more reliable sex prediction than distal, or lower humerus measurements.
47
Further, it has been observed that measurements of the humeral head are more diagnostic for sex determination than those of the femur.
48
It was, nonetheless, considered necessary to include distal measurements in this study, as not all the bones were complete. In addition, it has been found that for some populations, e.g. Indigenous Africans, distal measurements are more useful for sex determination.
49
France
50
found that diaphyseal or shaft diameters were much poorer sex indicators than either proximal or distal measurements. She suggested that the reason for this was that the diaphyseal shape displays a great deal of individual variation. The least circumference of the diaphysis was included in the data set as it enabled the inclusion of bones, which lacked articular processes.
The results for sex determination from the humerus suggested a more even distribution of males to females. Regardless of the technique used for dealing with the data, including exploratory tools, such as factor analysis, the results consistently separated the sample with a slightly higher frequency of males to females (Figure 6.4).
51
Nine femoral measurements were made on a sample of over 160 bones from the Forum Bath collection.
52
Only the left bone was used to avoid the possibility of the same individual being measured twice. Five standard measurements considered useful for sex determination were used. It has been claimed that sex determination from several femoral measurements, analyzed singly, is more reliable than that from cranial variables.
53
Additional measurements were included so that there would be sufficient measurements from incomplete bones to enable their inclusion in the study. Multivariate and other statistical methods were employed to determine whether two separate groups, presumably males and females, could be differentiated. The only metric data which appeared to be clearly bimodal were those for maximum length (Figure 6.5), though there was considerable overlap and some
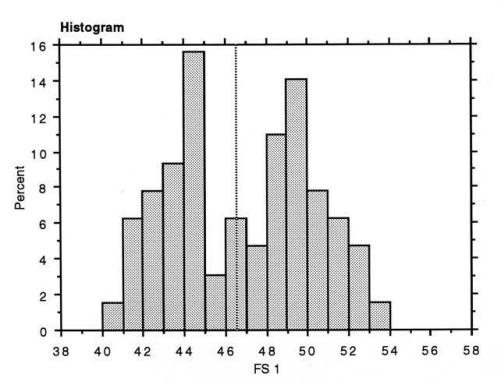 Figure 6.4
Frequency histogram of the non-standardized factor scores of the humerus measurements
skewing towards the lower, presumably more female, measurements. In addition, the results of the multivariate analysis were consistent with those obtained from univariate visualization.
In contrast with the results of the non-metric pelvic observations, the results for the femur indicated that there was considerable skewing towards more gracile individuals. It is possible that this is a reflection of sample bias from the Sarno Bath ‘cottage industry’ of hinge manufacture from human femora for furniture restoration (Chapter 5).
Sexual determination was based both on observations and metric examinations. Only unambiguously adult skulls were used for sex determination. Sixteen non-metric observations were used to distinguish sex from the Pompeian skulls.
54
The features that were chosen have traditionally been used for sex determination for archaeological populations.
55
These features employ characteristics that are considered to be good indicators of sex as they are based on relative robusticity and gracility. Like other non-metric traits, interpretation of the mid-range cases can be rather subjective. It has been noted that the usefulness of these indicators is dependent on prior knowledge
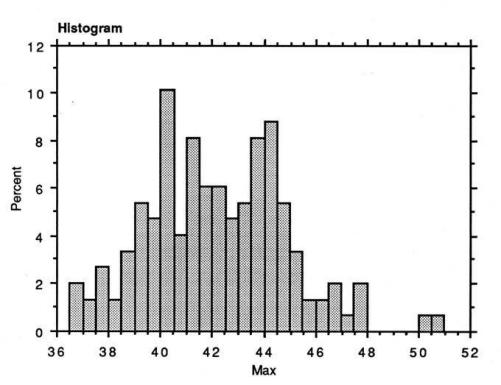 Figure 6.5
Frequency histogram of the maximum length of the femur
of the degree of sexual dimorphism of the population under investigation. Relative values were ascribed to different traits by the ‘Workshop of European Anthropologists’ so that these weights could be used to establish sex from a number of features.
56
However, the weightings they gave to nonmetric cranial traits are not necessarily applicable to an unknown population. Sex attribution was made in relation to the other skulls in the sample.
57
The non-metric skull data did not produce clearly de fined groups that could be interpreted as males and females. Different treatment of the data resulted in different relative proportions of males to females.
Examination of the individual traits showed that only a few features indicated possible bimodality.
58
Many of the cases for features were mid-range.
59
If the results for individual features displayed any evidence of skewing, it was generally towards the female range, though there were some features that showed an apparent bias towards males and one feature that separated into equal numbers of each sex.
60
A standardized but unweighted sex index was calculated, based on a linear combination of all the features, ranged around zero. If zero is used as a breakpoint, the ratio of males to females is 64 : 45 or 58.7 per cent : 41.3 per cent. The reliability of this result is limited, as it does not account for overlap. As mentioned above, a weighted index was also calculated, using the weightings recommended by the European Workshop of Anthropologists (WEA).
61
This also produced a higher number of skulls with more female than male features, the ratio being 63 : 46 or 57.8 per cent : 42.2 per cent. The strong correlation between these two indices for sex separation is apparent when they are plotted against each other in a scattergram (Figure 6.6).
The scores for overall shape (SHA) were adjusted for comparison with the two indices. It is notable that the proportion of ‘females’ to ‘males’ was only comparable to those obtained from the weighted and unweighted indices if the mid-range scores were included with those identified as ‘female’. This produced a ratio of 64 : 45. Otherwise, the breakdown was about 26 (23.9 per cent) ‘females’, 38 (34.9 per cent) indeterminate and 45 (41.3 per cent) ‘males’. Principal components analysis did not produce a clear separation into two groups.
62
If zero is used as a cut off point between ‘males’ and ‘females’, the frequency of ‘females’ to ‘males’ from the first principal component is 47.3 : 52.7. The second principal component was skewed to the more mid-range
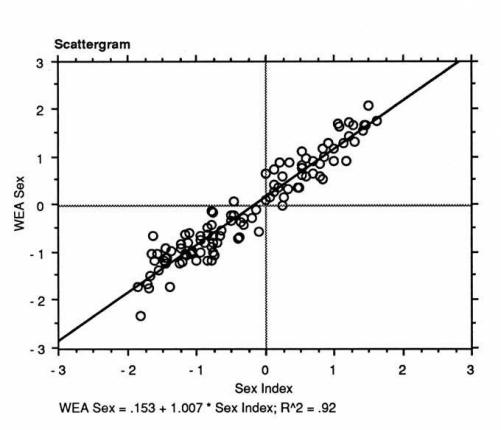 Figure 6.6
Scattergram of the two sex indices for non-metric skull features
Even though the skull has been traditionally used as one of the major sex indicators, it was only possible to have limited confidence in the results for sex determination from the skull for the Pompeian sample. Part of the problem could perhaps be related to the sample, which was not very dimorphic. This was recognized as a problem by D’Amore
et al
.
63
who expressed concern about the accuracy of the results they obtained on almost the same sample as the one used for the current study. They attributed the much higher frequency of males to females they identified in the sample to an artefact of the misdiagnosis of robust females. It is worth noting that my analysis produced a completely different set of results with a higher incidence of skulls with female attributes. A number of explanations can be used to account for this. First, they included juveniles in their sample, though one would have expected this to skew the results to the female range. Second, they used different criteria, such as cranial capacity, for sex determination. Finally, the sample appears to reflect a population that is somewhat androgynous and difficult to sex with consistency. It is significant that D’Amore
et al
. had problems with the determination of sex from this sample (see below), especially as D’Amore has had considerable experience with material from the Campanian region.
64
This suggests that the Pompeian sample may differ from other Campanian samples. In contrast, Bisel
65
considered the male and female skulls from Herculaneum easy to differentiate by sex, though she had the advantage of complete skeletons for comparison (see below).
The problem of the determination of sex from visual criteria on skulls is not confined to the material from Pompeii. Howells
66
included a lengthy discussion of the problems he encountered in attempting to determine sex from the skulls of the various populations he used in his craniometric analyses in his publications. He documented the problem of lack of concordance between observers. He also noted a possible tendency to favour female attribution. This is consistent with the results from the Pompeian sample. It is notable that Howells relied on morphological appearance rather than measurements to assess sex from the skull.
Choice of skull measurements for this study was determined by the constraints of preservation. The cranial vault tended to have much higher survival rates than the facial region for the majority of the sample and was able to provide the largest, most complete data set. Measurements were also chosen that could be used for comparisons with the work of other scholars. Twelve skull measurements were used to establish whether it would be possible to separate the adult skulls from the Forum Bath collection by sex based on a metric analysis. Standard definitions were used for these measurements.
67
Discriminant function analysis has traditionally been used for the determination of sex from skulls.
68
Discriminant function analyses are based on the extrapolation of parameters for sexual dimorphism from a known population onto unknown individuals to identify their sex. Interpopulation variation is significant enough to require the development of population-specific sets of equations.
69
As the Pompeian skeletal material derives from an unknown population, the use of a modern reference sample is likely to produce sex separations that do not reflect the actual sex ratio of the Pompeian victims. This analysis was not considered appropriate for the Pompeian sample.
The metric data proved to be more problematic for the determination of sex from the Pompeian skull sample than that based on inspection of nonmetric features.
70
No results that could be used with confidence were obtained from the metric study of sex separation. The variables were too weakly correlated to produce a successful principal components analysis. It could be argued that the lack of success in sex identification is a reflection of underlying heterogeneity of the Pompeian sample. This problem, however, is not restricted to heterogeneous material and can be illustrated by the following example.
A series of 25 head and facial measurements was made on a relatively homogeneous sample of 900 Swiss soldiers of the same age in order to design a few standard gas masks that would be suitable for a number of ‘typical’ faces. Principal components analysis was employed in an attempt to establish these ‘typical’ faces by reducing all the variables to a few principal components. The aim of the exercise was to rank all the individuals on the basis of the first principal component. The main proviso for the success of such an exercise was that the first principal component be well defined and account for a considerable portion of the total variance. The principal components analysis was ultimately based on ten of the measurements. The first principal component was found to account for only 43 per cent of the total variance and could not be used as an approximation of the sample. This was considered a surprising result given that the first principal component often accounts for more than 80 per cent of variance in morphometric studies. The conclusion drawn from this study was that there are numerous ways in which skulls and faces, in particular, can vary and it is not possible to represent them by a few dimensions without a significant loss of information.
71
Four features were observed on all the available adult mandibles from the Forum and Sarno Bath collections.
72
These features were chosen as they are based on relative robusticity and gracility and are generally accepted as good sex discriminators.
73
This appeared to be the case for the Pompeian sample. The first principal component accounted for 87 per cent of the variance and provided such good separation it could probably be used as a sex index (Figure 6.7). The split about the mean is very slightly in favour of males, with a frequency of females to males of 48 : 52.
The teeth of males tend to be larger than those of females. It has been suggested that two crown diameters, the bucco-lingual, or cheek to tongue sides, and mesio-distal, taken at 90 degrees from the bucco-lingual measurement, especially when combined as an index, are good indicators of sexual dimorphism. Studies on living populations indicate that the canines are the most useful sex separators. Considerable variation has been documented between populations. Within population overlap is also significant, especially in females, and it has been suggested that teeth should not be relied on as the sole means of sex determination.
74
Two problems were encountered with the assessment of the Pompeian teeth for sexual dimorphism. The main problem was the lack of survival of teeth in the Pompeian sample, especially single-rooted anterior teeth, which had often dropped out of their sockets and been lost. The second problem
