Windows Server 2008 R2 Unleashed (157 page)
Read Windows Server 2008 R2 Unleashed Online
Authors: Noel Morimoto

.
Better scaling of URL monitoring—
The URL monitor will now scale to thousands
of websites without undue performance impact.
.
Improved database performance—
The overall performance of the database and
console has been dramatically improved.
These improvements bring the platform to a new level of performance and interoperabil-
ity, while retaining the look and feel of the original Operations Manager 2007 tool.
OpsMgr is a sophisticated monitoring system that effectively allows for large-scale
management of mission-critical servers. Organizations with a medium to large investment
in Microsoft technologies will find that OpsMgr allows for an unprecedented ability to
keep on top of the tens of thousands of event log messages that occur on a daily basis. In
its simplest form, OpsMgr performs two functions: processing monitored data and issuing
alerts and automatic responses based on that data.
Explaining How OpsMgr Works
797
The model-based architecture of OpsMgr presents a fundamental shift in the way a
network is monitored. The entire environment can be monitored as groups of hierarchical
services with interdependent components. Microsoft, in addition to third-party vendors
and a large development community, can leverage the functionality of OpsMgr compo-
nents through customizable monitoring rules.
OpsMgr provides for several major pieces of functionality, as follows:
.
Management packs—
Application-specific monitoring rules are provided within
individual files called management packs. For example, Microsoft provides manage-
ment packs for Windows Server systems, Exchange Server, SQL Server, SharePoint,
23
DNS, DHCP, along with many other Microsoft technologies. Management packs are
loaded with the intelligence and information necessary to properly troubleshoot and
identify problems. The rules are dynamically applied to agents based on a custom
discovery process provided within the management pack. Only applicable rules are
applied to each managed server.
.
Event monitoring rules—
Management pack rules can monitor for specific event
log data. This is one of the key methods of responding to conditions within the
environment.
.
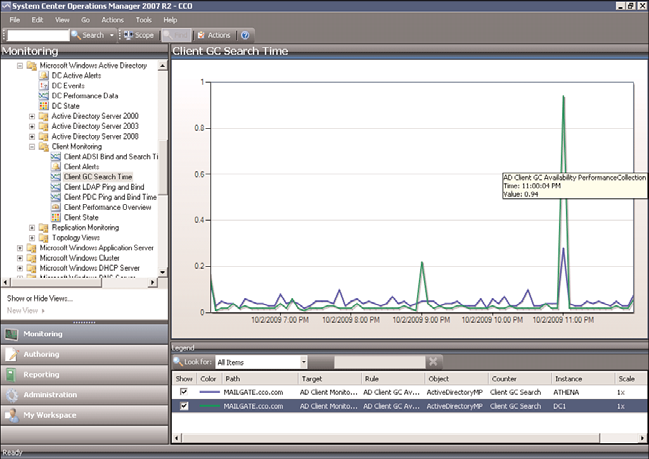
Performance monitoring rules—
Management pack rules can monitor for specific
ptg
performance counters. This data is used for alerting based on thresholds or archived
for trending and capacity planning. A performance graph shown in Figure 23.2
shows Client GC Search Time data for a couple of domain controllers. There was a
brief spike in latency at about 11:00 p.m., but the latency is normally less than 0.1.
FIGURE 23.2
Operations Manager 2007 R2 performance charts.
798
CHAPTER 23
Integrating System Center Operations Manager 2007 R2 with
Windows Server 2008 R2
.
State-based monitors—
Management packs contain monitors, which allow for
advanced state-based monitoring and aggregated health rollup of services. Monitors
also provide self-tuning performance threshold monitoring based on a two- or three-
state configuration.
.
Alerting—
OpsMgr provides advanced alerting functionality by enabling email
alerts, paging, short message service (SMS), instant messaging (IM), and functional
alerting roles to be defined. Alerts are highly customizable, with the ability to define
alert rules for all monitored components.
.
Reporting—
Monitoring rules can be configured to send monitored data to both the
operations database for alerting and the reporting database for archiving.
.
End-to-end service monitoring—
OpsMgr provides service-oriented monitoring
based on System Definition Model (SDM) technologies. This includes advanced
object discovery and hierarchical monitoring of systems.
Processing Operational Data
OpsMgr manages Windows Server 2008 R2 infrastructures through monitoring rules used
for object discovery, Windows event log monitoring, performance data gathering, and
application-specific synthetic transactions. Monitoring rules define how OpsMgr collects,
ptg
handles, and responds to the information gathered. OpsMgr monitoring rules handle
incoming event data and allow OpsMgr to react automatically, either to respond to a
predetermined problem scenario, such as a failed hard drive, with predefined corrective
and diagnostics actions (for example, trigger an alert, execute a command or script) to
provide the operator with additional details based on what was happening at the time the
condition occurred.
Generating Alerts and Responses
OpsMgr monitoring rules can generate alerts based on critical events, synthetic transac-
tions, or performance thresholds and variances found through self-tuning performance
trending. An alert can be generated by a single event or by a combination of events or
performance thresholds. Alerts can also be configured to trigger responses such as email,
pages, Simple Network Management Protocol (SNMP) traps, and scripts to notify you of
potential problems. In brief, OpsMgr is completely customizable in this respect and can
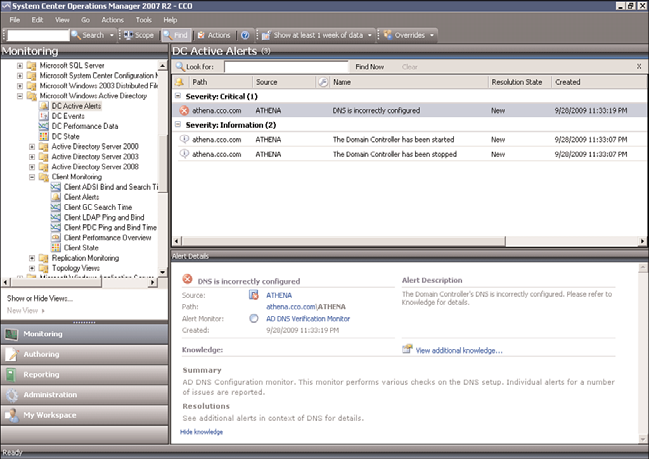
be modified to fit most alert requirements. A sample alert is shown in Figure 23.3. The
alert indicates that the domain controller’s DNS is incorrectly configured. Also note that
there are two information alerts shown, indicating that the domain controller stopped
and started.
OpsMgr is primarily composed of five basic components: the operations database, report-
ing database, Root Management Server, management agents, and Operations Console.
These components make up a basic deployment scenario. Several optional components are
Outlining OpsMgr Architecture
799
23
FIGURE 23.3
Operations Manager 2007 R2 alert.
ptg
also described in the following bulleted list; these components provide functionality for
advanced deployment scenarios.
OpsMgr was specifically designed to be scalable and can subsequently be configured to
meet the needs of any size company. This flexibility stems from the fact that all OpsMgr
components can either reside on one server or can be distributed across multiple servers.
Each of these various components provides specific OpsMgr functionality. OpsMgr design
scenarios often involve the separation of parts of these components onto multiple servers.
For example, the database components can be delegated to a dedicated server, and the
management server can reside on a second server.
The following list describes the different OpsMgr components:
.
Operations database—
The operations database stores the monitoring rules and the
active data collected from monitored systems. This database has a 7-day default
retention period.
.
Reporting database—
The reporting database stores archived data for reporting
purposes. This database has a 400-day default retention period.
.
Root Management Server—
This is the first management server in the manage-
ment group. This server runs the software development kit (SDK) and Configuration
service and is responsible for handling console communication, calculating the
health of the environment, and determining what rules should be applied to each
agent.
800
CHAPTER 23
Integrating System Center Operations Manager 2007 R2 with
Windows Server 2008 R2
.
Management server—
Optionally, an additional management server can be added
for redundancy and scalability. Agents communicate with the management server to
deliver operational data and pull down new monitoring rules.
.
Management agents—
Agents are installed on each managed system to provide effi-
cient monitoring of local components. Almost all communication is initiated from
the agent with the exception of the actual agent installation and specific tasks run
from the Operations Console. Agentless monitoring is also available with a reduction
of functionality and environmental scalability.
.
Operations Console—
The Operations Console is used to monitor systems, run
tasks, configure environmental settings, set author rules, subscribe to alerts, and
generate and subscribe to reports.
.
Web console—
The Web console is an optional component used to monitor
systems, run tasks, and manage Maintenance mode from a web browser.
.
Audit Collection Services—
This is an optional component used to collect security
events from managed systems; this component is composed of a forwarder on the
agent that sends all security events, a collector on the management server that
receives events from managed systems, and a special database used to store the
collected security data for auditing, reporting, and forensic analysis.
ptg
.
Gateway server—
This optional component provides mutual authentication
through certificates for nontrusted systems in remote domains or workgroups.
.
Command shell—
This optional component is built on PowerShell and provides full
command-line management of the OpsMgr environment.
.
Agentless Exception Monitoring—
This component can be used to monitor
Windows and application crash data throughout the environment and provides
insight into the health of the productivity applications across workstations and
servers.
.
Connector Framework—
This optional component provides a bidirectional web
service for communicating, extending, and integrating the environment with third-
party or custom systems.
The Operations Manager 2007 architecture is shown in Figure 23.4, with all the major
components and their data paths.
Understanding How OpsMgr Stores Captured Data
OpsMgr itself utilizes two Microsoft SQL Server databases for all collected data. Both data-
bases are automatically maintained through OpsMgr-specific scheduled maintenance tasks.
The operations database stores all the monitoring rules and is imported by management
packs and operational data collected from each monitored system. Data in this database is
retained for 7 days by default. Data retention for the operations database is lower than the
reporting database to improve efficiency of the environment. This database must be
Outlining OpsMgr Architecture
801
Audit
Operations
Reporting
Reporting
Gateway
Database
Database
Data Warehouse
Server
GTW
SQL
SQL
SQL
RS
Ops
Ops
Mgr
Mgr
Audit
DB
DW
MS
MS
MS
Web
Console
Firewall
23
Audit
Management
Root
Collector
Server
Management
Server
Operations
Console
Operations
Agents
Console
DMZ Agents
FIGURE 23.4
Operations Manager 2007 R2 architecture.
ptg
installed as a separate component from OpsMgr but can physically reside on the same
server, if needed.