The Crash Course: The Unsustainable Future of Our Economy, Energy, and Environment (15 page)
Read The Crash Course: The Unsustainable Future of Our Economy, Energy, and Environment Online
Authors: Chris Martenson
Tags: #General, #Economic Conditions, #Business & Economics, #Economics, #Development, #Forecasting, #Sustainable Development, #Economic Development, #Economic Forecasting - United States, #United States, #Sustainable Development - United States, #Economic Forecasting, #United States - Economic Conditions - 2009

The fact that bubbles display the same price behaviors over the centuries and decades tells us that they’re not artifacts of particular financial arrangements, cultures, or legal systems. Instead, the constant factor is people. Bubbles do not develop as a condition of poor financial engineering or specific financial laws and regulations that happen to be present, nor because of particular cultural practices, but as the by-product of greed, hope, and excessive credit. Wherever these circumstances exist, bubbles will eventually develop, which is why investors should hold onto their wallets whenever they spot such conditions.
Asset bubbles, therefore, aren’t so much financial phenomena upon which we can conduct meaningful financial post mortems as they are sociological events best understood through the study of human psychology and mob behavior. Perhaps we can even speculate that bubble behavior is wired into our biological software, an evolutionary remnant that was useful in our deep past but is now a profound liability when it comes to making investment choices.
That bubbles happen isn’t the surprising part of this story; rather, it’s that well-educated people responsible for knowing about such things have apparently never learned that bubbles aren’t rare and random events but are very common and predictable features of the economic landscape. In their defense, perhaps these people have learned about bubbles, but then mistakenly overestimate their ability to manage their destructive effects (yes, I am talking about Alan Greenspan here).
By way of illustration, the Federal Reserve entirely missed the opportunity to nip both the 1990s stock and 2000s housing bubbles in the bud, and even devoted considerable internal resources to the task of proving to itself that no housing bubble existed. Even as a number of analysts and commentators (including me) were warning of a housing bubble back in 2004, the Fed released a study titled “Are Home Prices the Next Bubble?” which concluded that the answer was no.
Here’s the main conclusion of that paper:
Home prices have been rising strongly since the mid-1990s, prompting concerns that a bubble exists in this asset class and that home prices are vulnerable to a collapse that could harm the U.S. economy. A close analysis of the U.S. housing market in recent years, however, finds little basis for such concerns. The marked upturn in home prices is largely attributable to strong market fundamentals: Home prices have essentially moved in line with increases in family income and declines in nominal mortgage interest rates.
6
All of that sounds perfectly logical, and the paper is stuffed with comforting and supportive data, but it is also completely and hopelessly wrong. Although they should arguably have known better, the Fed’s researchers were simply doing what millions of people did; namely, falling prey to the belief that somehow “this time it’s different.” That’s just how bubbles are. People take leave of their senses, using all manner of rationales to justify their positions, but then suddenly one day the illusion lifts, and what was once unassailably true no longer makes any sense at all. Once that tipping point occurs, there’s really nothing left to do but track the speed of the bubble’s collapse and the damage it will cause.
The Housing Bubble
Let’s focus a bit more of our attention on the housing bubble that burst in 2007. It is important to show just how obvious this bubble was. Anyone with a tiny bit of bubble history under their belt and access to some publicly available data can appreciate its clarity.
Because a bubble occurs when asset prices rise beyond what incomes can sustain, I’m not so interested in the actual prices of houses all by themselves, but I am keenly interested in the ratio of house prices to income. Because the amount that people can afford to pay sets an ultimate limit on house prices, it is impossible for median house prices to forever rise faster than median incomes. Sooner or later, when illusions lift, that dynamic comes to a halt, and at that point, the last buyers will be in the same position as the last purchasers of tulip bulbs in 1637.
Figure 11.3
compares median household incomes to median house prices. If what the Fed research paper said was correct and housing prices rose in alignment with incomes, the two lines would overlay each other perfectly and never depart, but that’s not what we see. Instead we observe that even before the year 2000, median house prices elevated away from median incomes and were hopelessly separated by the time the Fed was convincing itself no bubble existed in 2004.
Figure 11.3
Median Income and Housing

Sources:
Census Department (Median Income) and Office of Federal Housing Enterprise Oversight (Housing).
The housing bubbles of 1979 and 1989 (marked with arrows) were quite sedate in comparison to the most recent housing bubble and aren’t very dramatic on this graph. The fact that median incomes did not deviate especially far from those prior bubbles’ house prices helped to limit the damaging effects of the bursting of those bubbles. Painful though these burstings were, house prices did not have to fall very far before they were once again aligned with incomes.
But look at the enormous gap between house prices and incomes for the most recent housing bubble. There’s no historical precedent for the size of that gap, and there were disturbing warning signs as early as 1999 that things were getting off track. It’s interesting to ponder how the Federal Reserve had access to this same data but still managed to convince itself that nothing was amiss. In fact, at the time, Greenspan was busy extolling the wonders and virtues of the massive “wealth-creating” effect of housing for the average person, apparently unaware of the wealth-destroying impacts of the future bursting of the bubble he enabled.
7
It was completely obvious that we had a bubble on our hands, and prudent people could have simply looked at this data and then trusted themselves to avoid getting swept up in it.
But back to the story. Based on simple calculations performed on the base data for
Figure 11.3
, we can predict a minimum 34 percent national decline for house prices from peak to trough. That’s what is required to get those income and housing price lines back together again. Given the propensity of bubbles to sometimes overshoot to the downside, we can’t discount the possibility that a steeper decline of perhaps 40 percent or even 50 percent is in store. That was my conclusion, published in 2007,
8
and it seems as sound here in 2010 as it did then. Based on
Figure 11.3
and the assumption that the housing bubble will burst with the same rough symmetry as prior bubbles, my prediction is that housing prices in the United States will bottom in 2015.
A Bubble Thirty Years in the Making
All of this review of bubbles was meant to get us to the point where we could talk about the biggest and what will almost certainly be the most destructive bubble in history: The Great Credit Bubble.
So far (as of 2010) this bubble, like every serious bubble worthy of mention, has largely escaped attention. Most economic experts are convinced that a credit bubble doesn’t exist, and few people think twice about using credit in their daily lives or dwell on the past four decades of debt accumulation. Bubbles that have not yet collapsed are incredibly hard for most people to detect; that’s why they exist in the first place.
As mentioned in Chapter 10 (
Debt
), total credit in the United States has doubled five times over the four decades between 1970 and 2010. At the end of 2000, when the stock bubble was bursting, total credit market debt stood at $26 trillion, but by the end of 2008 it stood at an astounding $52 trillion. This $26 trillion increase in borrowing was five times larger than the increase in U.S. Gross Domestic Product (GDP) over the same period of time. As profound as the housing bubble was, it represented only a small piece—only around $5 trillion out of $26 trillion
9
—of this massive surge in debt.
Figure 11.4
Growth in GDP Compared to Total Credit Market Debt
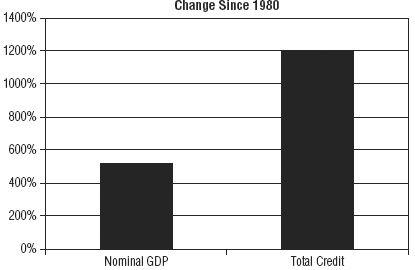
1980 to present. Both in nominal dollars. Debt excludes all unfunded liabilities.
Source:
Federal Reserve.
If the idea is that debt is meant to be paid back, then over the long term debt cannot rise faster than income. Now let’s look at the increase in the size of the United States’s debt compared to its GDP over the past 30 years.
Where debts have increased by just over 1200 percent since 1980, GDP has advanced by just under 520 percent. Imagine your credit card bills growing at more than twice the rate of your income for the next 30 years. Sooner or later that has to come to a stop. It is a thoroughly unsustainable proposition.
Recall that the definition of an asset bubble is that it exists when asset prices rise beyond what incomes can sustain. This means that on the other side of every asset bubble lurks an equal-sized credit bubble. Bubbles usually end, not because of any significant shift in the worth of the coveted assets, but because credit runs dry, which reveals the main storyline to be false. Without credit as a fuel, bubbles deflate.
What then should we think of this mountain of debt, or credit, which has been consistently expanding faster than GDP (or income)? Given that this matches the very definition of a bubble, it might be prudent to dedicate some thought to what will happen if—or when—that bubble bursts. When viewed this way, housing becomes a sideshow, instead of being the epicenter of the bubble. It is an eddy in a much larger ocean of debt that has been 40 years in the making.
Figure 11.5
Credit Market Debt Outstanding
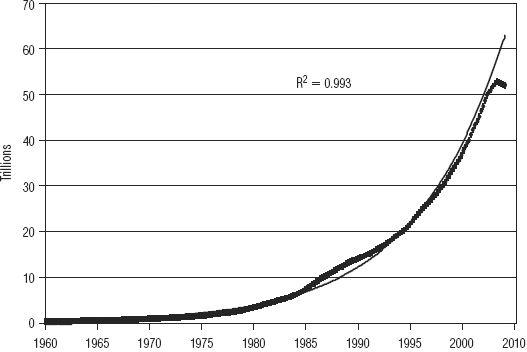
With exponential ‘fit’ yielding an “R-squared” of 0.99.
Source:
Federal Reserve.
Exponential Debt
There are two ways to go about understanding things: One is to build your knowledge from the ground up, piece by piece, and the other is to stand back, look at the big picture, and then work backward to deepen your understanding of the system. If we look at growth in the credit markets over the past several decades, we might note that not only has credit been growing, but it has been growing in a nearly perfect exponential fashion.
1