Microsoft Visual C# 2005 Express Edition: Build a Program Now! (27 page)
Read Microsoft Visual C# 2005 Express Edition: Build a Program Now! Online
Authors: Patrice Pelland
Tags: #General, #Computers, #C♯ (Computer program language), #Programming Languages, #C#, #Microsoft .NET Framework, #Computer Books: Languages, #Computer Graphics, #Application software, #C# (Computer program language), #Programming, #Microsoft Visual C# .NET, #Microsoft Visual C♯ .NET, #Electronic books, #Game Programming & Design, #Computing: Professional & Programming, #C (Computer program language), #Computers - Languages, #Programming Languages - C#, #Programming & scripting languages: general

When the debugger encounters a breakpoint, it stops executing the application. In this source code, one of the breakpoints is on the call to the
MessageBox.Show(myString);
. There is another breakpoint in the Library.cs in the first line of code of the Divide method. In the following procedure, you will execute the code and go through a debugging session. To debug an application, you can do one of two things:
■ Press F5 or the Start Debugging button.
The program will start executing normally. If there is a breakpoint in the source code, the execution will stop there. Otherwise, the program will continue to execute unless there is an unhandled exception, or error.
■ Alternatively, you can debug the application by stepping through the code line by line. To do this, press F11 or the Step Into button.
For now, you’ll jump to the first breakpoint and execute the code in the sample program using the first technique.
TO BEGIN DEBUGGING AN APPLICATION
1 Press
F5
or the
Start Debugging
button.
You will see a button that says
Try Me!
Click it. The code should stop executing at the first breakpoint 2 in the Divide method, and you should see what is shown in Figure 7-4. The yellow highlighted line means it is the next statement to be executed.
Figure 7-4
Execution stopped at the first breakpoint in the
Divide method
Chapter 7: Fixing the Broken Blocks
115
C07622299.indd 115
C07622299.indd 115
10/24/05 7:13:55 PM
10/24/05 7:13:55 PM


You’re now in debugging mode, and you have access to a plethora of tools and data elements about your application to help you understand what is happening when your application is executed. You can see the content of local variables, parameters, exception messages, the console window, and many more items you’ll discover in the next few steps. All of that information is useful when an application is not behaving the way it should and you’re trying to understand why. With all the information the debugger provides, you can try to uncover where the problem lies and see why you have a bug. You can also use the debugger for learning purposes as you are doing right now. The debugger is an excellent teacher when you’re new to a technology, language construct, or when you’re simply trying to understand a new element. It is also common to use the debugger to understand someone else’s code. It is especially helpful when you need to make modifications to existing code. You’ll now look at the first series of data elements offered by the debugger while you’re stepping through your code. At the bottom of the Visual Studio screen, you can see a series of tabs, which can include
Locals, Watch, Call Stack, Immediate Window, Output,
and
Error List
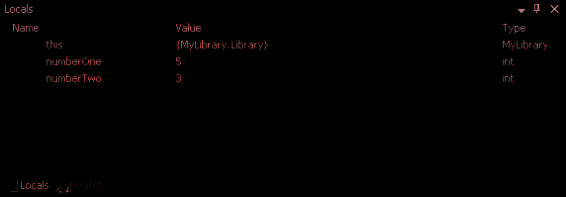
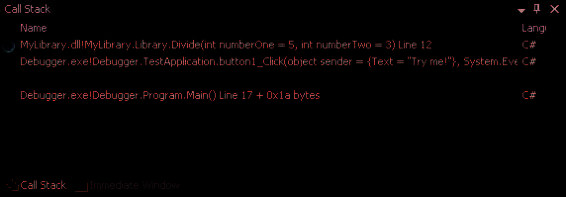
. If you don't see these tabs, you can open these windows by selecting them on the View and Debug menus. Most of these are not visible when in editing mode. You saw in Chapter 3 that the Error List is only there to show the results of the real-time compilation. While you’re debugging, the Locals tab is usually on top and shows the current variables and object information, and beside it you’ll see the Call Stack that displays all methods that have been called, enabling you to follow the execution of your application at any given point during the debugging. Look at Figure 7-5a and Figure 7-5b to see the two windows.
(a)
(b)
Figure 7-5
Tabs present during debugging in Visual Studio
116
Microsoft Visual C# 2005 Express Edition: Build a Program Now!
C07622299.indd 116
C07622299.indd 116
10/24/05 7:13:55 PM
10/24/05 7:13:55 PM

In the Locals tab section, you can see three elements of data from your Divide method: this, numberOne, and numberTwo. Those are, in order, the instance of the current object and the two parameters. The debugger detects all elements that are in scope in that method and displays them in the Locals tab. The elements in scope are all the elements that are visible from where the instruction pointer is located. In this case, it could be either local variables or static variables. This means that throughout the execution of the Divide method, you’ll be able to follow the values that those items will have. Now it’s your turn to see this for yourself.
TO CONTINUE DEBUGGING THE APPLICATION
1 Press
F11
or the
Step Into
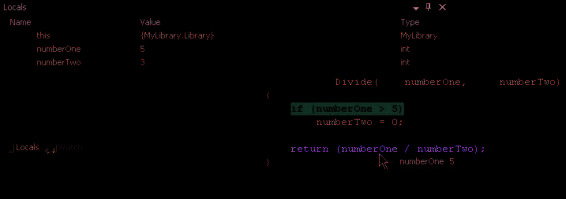
button to get to the division operation. While debugging, you can always hover the mouse over program elements to get the information you otherwise find in the Locals tab. For instance, if you hover your mouse over the numberOne element, you’ll see the same value that is shown in the Locals tab, as illustrated in Figure 7-6.
Figure 7-6
Getting the value of the numberOne local variable in
two different ways
Execute the next line of code by pressing either
F11
or the
Step Into
button on the toolbar or in the 2 Debug menu.
Chapter 7: Fixing the Broken Blocks
117
C07622299.indd 117
C07622299.indd 117
10/24/05 7:13:56 PM
10/24/05 7:13:56 PM
At this point, you can see the results of the division by selecting the operands in the return statement and hovering the mouse over the selection. Verify that it’s 1. Now let’s say it is a more complex operation and you would like to see the outcome of a change in the source code or a change in the content of a variable. Previously you would have to stop the debugging process, change the values, recompile, and see the outcome. But now there is a new feature in Visual C# 2005 that allows you to modify your code and verify immediately if the change you make solves the problem. This feature is called
Edit and Continue
. As its name implies, the Edit and Continue feature lets you edit an element in the application and continue the execution. In fact, not only can you do this, but you can also modify the next instruction to execute, change the value of a variable, and re-execute the instruction again. This is a huge time saver in some cases because you don’t have to stop the execution, make the change, rebuild, and re-execute the new code. You can see the changes right away.
Go to the left-hand side, where the yellow arrow indicates the next instruction to be executed. When 3 you hover your mouse over the yellow arrow, you should see a transparent arrow indicating that you
can move the arrow. Click and hold the yellow arrow and slide it up and back over the
if
statement.
There are some limitations to the
Edit and Continue edits you can
make. To see a complete list, sim-
4 Change the value of numberOne to -5 by hovering your mouse over the variable, clicking on the number 5 in the tooltip that appears, and then modifying it to
-5
. You can also modify the values in
ply perform a search in the help
system with the following search
the Locals tab at the bottom of the IDE. Then re-execute the instruction by pressing
F11
or clicking the
criteria: Edit and Continue [Visual
Step Into
button.
C#], and then look for the two
unsupported sections that explain
what can’t be done.
Step into the code until you see a message box with -1 for the first division. If you don’t see the mes5 sage box, you might need to switch to it on the Windows Taskbar. Click
OK
in the message box. Continue stepping into the code until you return to the Divide method with a new set of values and you’re pointing at the first instruction in the method.
When you’re back to the Divide method, you will not re-execute every instruction. Instead, you’ll step out of the code using the Step Out function. Stepping out doesn’t mean that you’ll skip the execution; stepping out simply means that the debugger will execute all instructions of the current method and go back to the calling point. If you do it on a single instruction that is not part of a function source code, it will simply execute it. To see this in action, follow these steps.
TO STEP OUT OF THE CODE
In the Library.cs file, click the red dot in the first breakpoint of the Divide method. By clicking the red 1 dot, you actually remove the breakpoint. The breakpoint should now be gone. 2 To disable the second breakpoint, you can use three different methods.
118
Microsoft Visual C# 2005 Express Edition: Build a Program Now!
C07622299.indd 118
C07622299.indd 118
10/24/05 7:13:57 PM
10/24/05 7:13:57 PM

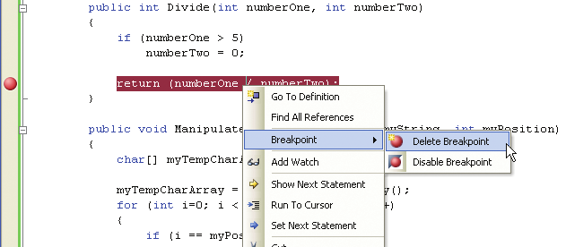
The first one is simply to right-click the line of code that has the breakpoint, then select the
Breakpoint...
menu choice, and finally select the
Delete Breakpoint
choice. Look at Figure 7-7 to see this in action. The second method is to select the
Debug
menu and then select
Toggle Breakpoint
or press
F9
. The third method is to right-click the red dot indicating the breakpoint and select
Delete Breakpoint
.
Figure 7-7
Delete a breakpoint from a contextual
menu in the code editor
You should be at the first line of code in the Divide method. Press
Shift+F11
to step out of the Divide 3
method or you can press the
Step Out
button. This will execute all the instructions in that method
The using block guarantees that
and go back to the caller.
you’re going to dispose of the
resources you’re using when you
exit the block. You can read more
4 Press
F5
to execute all methods up to the next breakpoint.
about this by doing a search in the
Help system in the Look For text
You should see another message box with the result 1. Click
OK
and then you should be stopped in the
box using the using statement as
