Read Junk DNA: A Journey Through the Dark Matter of the Genome Online
Authors: Nessa Carey
Junk DNA: A Journey Through the Dark Matter of the Genome (26 page)

X inactivation is critically dependent on the Xist long non-coding RNA spreading along the chromosome on which it is expressed. But Xist doesn’t spread into the pseudoautosomal regions. The protection from this in the pseudoautosomal region shows us that our genomes have evolved in such a way that at key positions, they can draw a line in the sand. As Jean-Luc Picard declared, in reference to Borg incursions into Federation space, ‘The line must be drawn here! This far, no farther!’
10
Junk insulator regions prevent the creeping genomic paralysis that spreads out from the Xist locus.
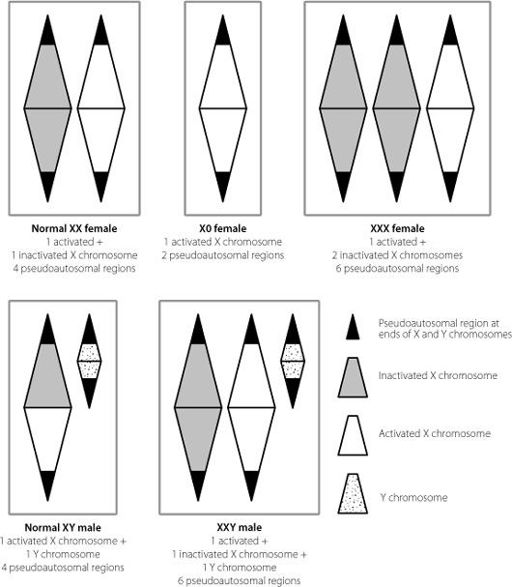
Figure 13.3
The effects of different numbers of X chromosomes in male and female cells. Because of X inactivation, there is only one active X chromosome in each cell. But because the pseudoautosomal regions at the ends of the X and Y chromosomes escape X inactivation, their numbers increase or decrease pathologically with changes in X chromosome number.
Figure 13.3 shows how these non-silenced regions result in changes in people who have the wrong numbers of X chromosomes. A woman who only has one X chromosome expresses 50 per
cent of the normal amounts of gene products from the pseudo-autosomal regions as a typical XX woman. A woman with three X chromosomes produces 50 per cent more of these gene products than normal, as does a male with two X chromosomes and a Y.
It’s no coincidence that both males and females with an extra X chromosome are taller than average, and women lacking an X tend to be on the short side. The pseudoautosomal region contains a particular protein-coding gene
c
11
which controls the expression of other genes and is important for development of the skeleton, especially the long bones of the arms and legs. Men and women with extra X chromosomes express more of this protein than normal, which tends to increase leg length and hence height. The opposite is true for women lacking an X chromosome. It’s one of the few examples in the human genome where we can really identify a single region which has a significant impact on the normal range of human height. Outside of this region, height is influenced by multiple sites in the genome,
12
and many of these are regions of junk DNA, where we don’t yet know how they individually contribute to making you a Harlem Globetrotter, or someone who is always overlooked in a bar.
Footnotes
a
There are a couple of exceptions to this where genes are clustered in a way that reflects their expression patterns. The main ones are the HOX genes that control body patterning and the Ig genes that code for antibodies.
b
The formal name for this is CTCF.
c
This protein is known as SHOX or ‘short stature homeobox’.
14. Project ENCODE – Big Science Comes to Junk DNA
If you ever find yourself far from city lights, on a cloudless night with no moon, grab a blanket and lie on the ground and look up at the stars. It’s one of the most wonderful sights imaginable, and quite breathtaking for anyone who spends their life in a city. The glints of silver in the dark blanket of the heavens seem too many to count.
But – if you have access to a telescope, you realise that there is so much more in the firmament than you can detect with the naked eye. There are details like the rings of Saturn, and there are vastly more stars than we could ever imagine. There is so much more in the apparent darkness of the universe than can be seen just with our limited unaided vision. This becomes even more obvious if we use equipment that can detect the energy in the other parts of the electromagnetic spectrum, beyond just the visible wavelengths. More information keeps pouring in, from gamma waves to the microwave background. Those details and those stars have always been there, we just couldn’t detect them when we relied only on eyesight.
In 2012, a whole slew of papers was published that attempted to turn a telescope onto the furthest reaches of the human genome. This was the work of the ENCODE consortium, a collaborative effort involving hundreds of scientists from multiple different institutions. ENCODE is an acronym derived from
Enc
yclopaedia
O
f
D
NA
E
lements.
1
Using the most sensitive techniques available, the researchers probed multiple features of the human genome, analysing nearly 150 different cell types. They integrated the data in a consistent way, so that they could compare the outputs from the different techniques. This was important because it’s very difficult to make comparisons between data sets that have been generated and analysed differently from each other. Such piecemeal data were what we had previously relied on.
When the ENCODE data were published, there was an enormous amount of attention from the media, and from other researchers. Press coverage included headlines such as ‘Breakthrough study overturns theory of “junk DNA” in genome’;
2
‘DNA project interprets “Book of Life”’
3
and ‘Worldwide army of scientists cracks the “junk DNA” code’.
4
We might imagine that other scientists would all be congratulatory, and even grateful for all the additional data. And a lot were really fascinated, and are using the data every day in their labs. But the acclaim has been far from universal. Criticism has come mainly from two camps. The first is the junk sceptics. The second is the evolutionary theorists.
To understand why the first group were upset, we can examine one of the pithiest statements in the ENCODE papers:
These data enabled us to assign biochemical functions for 80% of the genome, in particular outside of the well-studied protein-coding regions.
5
In other words, instead of being mainly dark sky with less than 2 per cent of the space occupied by stars, ENCODE was claiming that in our genome four-fifths of the celestial canopy is filled with objects. Most of the objects aren’t stars, assuming stars represent the protein-coding genes. Instead, they could be asteroids, planets, meteors, moons, comets and any other interstellar objects you can think of.
As we have seen, many research groups had already assigned functions to some of the dark area, including promoters, enhancers, telomeres, centromeres and long non-coding RNAs. So most scientists were comfortable with the idea that there was more to our genome than the small proportion that encoded proteins. But 80 per cent of the genome having a function? That was a really bold claim.
Although startling, these data had been foreshadowed by indirect analyses in the previous decade by scientists trying to understand why humans are so complicated. This was the problem by which so many people had been puzzled ever since the completion of the human genome sequence failed to find a larger number of protein-coding genes in humans than in much simpler organisms. Researchers analysed the size of the protein-coding part of the genome in different members of the animal kingdom and also the percentage of the overall genome that was junk. The results, which we touched on in Chapter 3, are shown in Figure 14.1.
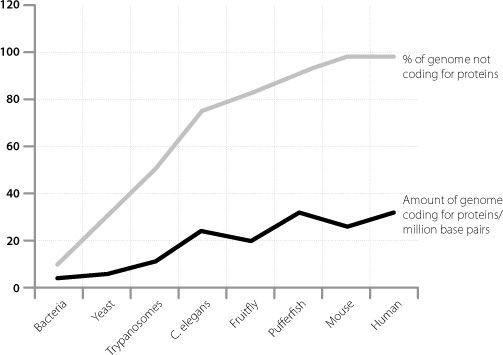
Figure 14.1
Graphical representation showing that organismal complexity scales more with the proportion of junk DNA in a genome than with the size of the protein-coding part of the same genome.
As we have seen, the amount of genetic material that codes for proteins doesn’t scale very well with complexity. There is a much more convincing relationship between the percentage of junk in the genome and how complicated an organism is. This was interpreted by the researchers as suggesting that the difference between simple and complex creatures is mainly driven by junk DNA. This in turn would have to imply that a significant fraction of the junk DNA has function.
6
Multiple parameters
ENCODE calculated its figures for level of function in our genome by combining all sorts of data. These included information on the RNA molecules that they detected. These were both protein-coding and ones that didn’t code for protein, i.e. junk RNAs. They ranged in size from thousands of bases to molecules a hundred times smaller. ENCODE also defined genome regions as being functional if they carried particular combinations of epigenetic modifications that are usually associated with functional regions. Other methodologies involved analysing regions that looped together in the way that we encountered in the previous chapter. Yet another technique was to characterise the genome in terms of specific physical features associated with function.
a
These features varied across the different human cell types analysed, reinforcing the concept that there is a great deal of plasticity in how cells can use the same genomic information. For example, analyses of looping found that any one specific interaction between different regions was only detected in one out of three cell types.
7
This suggests that the complex three-dimensional folding of our genetic material is a sophisticated, cell-specific phenomenon.
When looking at the physical characteristics that are typically associated with regulatory regions, researchers concluded that these regulatory DNA regions are also activated in a cell-dependent manner, and in turn that this junk DNA shapes cell identity.
8
This conclusion was reached after the scientists identified nearly 3 million such sites from analysis of 125 different cell types. This doesn’t mean that there were 3 million sites in each cell type. It means that 3 million were detected when the different sites from each cell type were added up. Yet again, this suggests that the regulatory potential of the genome can be used in different ways, depending on the needs of a specific cell. The distribution of the sites among different cell types is shown in Figure 14.2.
Over 90 per cent of the regulatory regions identified by this method were more than 2,500 base pairs away from the start of the nearest gene. Sometimes they were far from any gene at all, in other cases they were in a junk region within a gene body, but still far from the beginning.
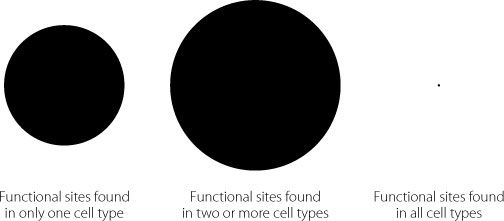
Figure 14.2
Researchers analysing the ENCODE data sets identified over 3 million sites with the characteristics of regulatory regions, when they assessed multiple human cell lines. The areas of the circles in this diagram represent the distribution of these sites. The majority were found in two or more cell types, although a large fraction was also specific to individual cell types. Only a very small percentage were found in every cell line that was analysed.
