Windows Server 2008 R2 Unleashed (280 page)
Read Windows Server 2008 R2 Unleashed Online
Authors: Noel Morimoto

To access the Performance Options window, do the following:
1. Click Start.
2. Right-click on Computer and select Properties.
3. Click on the Advanced System Settings link on the left.
4. When the System Properties window opens, click the Settings button under the
Performance section.
5. Select the Advanced tab.
6. Click Change under Virtual Memory.
Monitoring System Performance
1419
34
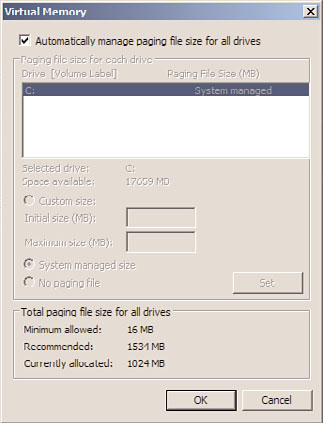
FIGURE 34.15
Virtual Memory configuration options.
ptg
TIP
Windows will normally automatically handle and increase the size of pagefile.sys as
needed; however, in some cases you might want to increase performance and manage
virtual memory settings yourself. Keeping the default pagefile on the system drive and
adding a second pagefile to another hard disk can significantly improve performance.
Spanning virtual memory across multiple disks or simply placing the pagefile.sys on
another, less-used disk, will also allow Windows to run faster. Just ensure that the
other disk isn’t slower than the disk pagefile.sys is currently on. The more physical
memory a system has, the more virtual memory will be allocated.
Analyzing Processor Usage
Most often, the processor resource is the first one analyzed when there is a noticeable
decrease in system performance. For capacity-analysis purposes, you should monitor two
counters: % Processor Time and Interrupts/sec.
The % Processor Time counter indicates the percentage of overall processor utilization. If
more than one processor exists on the system, an instance for each one is included along
with a total (combined) value counter. If this counter averages a usage rate of 50% or
greater for long durations, you should first consult other system counters to identify any
processes that might be improperly using the processors or consider upgrading the proces-
sor or processors. Generally speaking, consistent utilization in the 50% range doesn’t
necessarily adversely affect how the system handles given workloads. When the average
processor utilization spills over the 65% or higher range, performance might become
1420
CHAPTER 34
Capacity Analysis and Performance Optimization
intolerable. If you have multiple processors installed in the system, use the % Total
Processor Time counter to determine the average usage of all processors.
The Interrupts/sec counter is also a good guide of processor health. It indicates the number
of device interrupts that the processor (either hardware or software driven) is handling per
second. Like the Page Faults/sec counter mentioned in the section “Monitoring System
Memory and Pagefile Usage,” this counter might display very high numbers (in the thou-
sands) without significantly impacting how the system handles workloads.
Conditions that could indicate a processor bottleneck include the following:
. “Average of % Processor Time” is consistently over 60%–70%. In addition, spikes
that occur frequently at 90% or greater could also indicate a bottleneck even if the
average drops below the 60%–70% mark.
. “Maximum of % Processor Time” is consistently over 90%.
. “Average of the System Performance Counter; Context Switches/second” is consis-
tently over 20,000.
. The “System Performance Counter; Processor Queue Length” is consistently greater
than two.
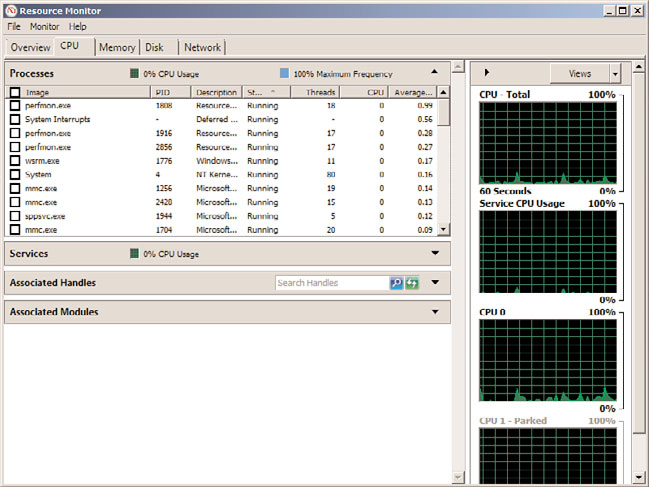
By default, the CPU tab in Resource Monitor, shown in Figure 34.16, provides a good
ptg
high-level view of current processor activity. For more advanced monitoring of processors,
use the Performance Monitor snap-in with the counters discussed previously.
FIGURE 34.16
CPU section of the Resource Monitor.
Monitoring System Performance
1421
Evaluating the Disk Subsystem
Hard disk drives and hard disk controllers are the two main components of the disk
subsystem. The two objects that gauge hard disk performance are Physical and Logical
Disk. Although the disk subsystem components are becoming more and more powerful,
they are often a common bottleneck because their speeds are exponentially slower than
other resources. The effects, though, can be minimal and maybe even unnoticeable,
depending on the system configuration.
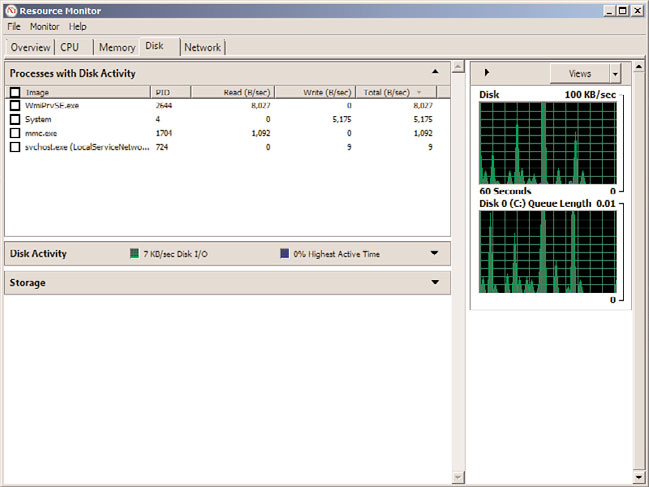
To support the Resource Monitor’s Disk section, the physical and logical disk counters are
enabled by default in Windows Server 2008 R2. The Disk section in Resource Monitor,
shown in Figure 34.17, provides a good high-level view of current physical and logical
disk activity (combined). For more advanced monitoring of disk activity, use the
Performance Monitor component with the desired counters found in the Physical Disk
and Logical Disk sections.
34
ptg
FIGURE 34.17
Disk section of the Resource Monitor.
Monitoring with the Physical and Logical Disk objects does come with a small price.
Each object requires a little resource overhead when you use them for monitoring. As a
result, you might want to keep them disabled unless you are going to use them for moni-
toring purposes.
So, what specific disk subsystem counters should be monitored? The most informative
counters for the disk subsystem are % Disk Time and Avg. Disk Queue Length. The % Disk
Time counter monitors the time that the selected physical or logical drive spends servicing
1422
CHAPTER 34
Capacity Analysis and Performance Optimization
read and write requests. The Avg. Disk Queue Length monitors the number of requests not
yet serviced on the physical or logical drive. The Avg. Disk Queue length value is an inter-
val average; it is a mathematical representation of the number of delays the drive is expe-
riencing. If the delay is frequently greater than 2, the disks are not equipped to service the
workload and delays in performance might occur.
Monitoring the Network Subsystem
The network subsystem is by far one of the most difficult subsystems to monitor because
of the many different variables. The number of protocols used in the network, network
interface cards, network-based applications, topologies, subnetting, and more play vital
roles in the network, but they also add to its complexity when you’re trying to determine
bottlenecks. Each network environment has different variables; therefore, the counters
that you’ll want to monitor will vary.
The information that you’ll want to gain from monitoring the network pertains to
network activity and throughput. You can find this information with the Performance
Monitor alone, but it will be difficult at best. Instead, it’s important to use other tools,
such as Network Monitor, discussed earlier in this chapter in the section “Network
Monitor,” in conjunction with Performance Monitor to get the best representation of
network performance as possible. You might also consider using third-party network
ptg
analysis tools such as network sniffers to ease monitoring and analysis efforts. Using these
tools simultaneously can broaden the scope of monitoring and more accurately depict
what is happening on the wire.
Because the TCP/IP suite is the underlying set of protocols for a Windows Server 2008 R2
network subsystem, this discussion of capacity analysis focuses on this protocol.
NOTE
Windows Server 2008 R2 and Windows 7 deliver enhancement to the existing Quality
of Service (QoS) network traffic–shaping solution that is available for XP and Windows
Server 2003. QoS uses Group Policy to shape and give priority to network traffic with-
out recoding applications or making major changes to the network. Network traffic can
be “shaped” based on the application sending the data, TCP and/or UDP addresses
(source and/or destination), TCP or UDP protocols, and the ports used by TCP or UDP
or any combination thereof. More information on QoS can be found at Microsoft
TechNet: http://technet.microsoft.com/en-us/network/bb530836.aspx.
Several different network performance objects relate to the TCP/IP protocol, including
ICMP, IPv4, IPv6, Network Interface, TCPv4, UDPv6, and more. Other counters such as
FTP Server and WINS Server are added after these services are installed. Because entire
books are dedicated to optimizing TCP/IP, this section focuses on a few important coun-
ters that you should monitor for capacity-analysis purposes.
First, examining error counters, such as Network Interface: Packets Received Errors or
Packets Outbound Errors, is extremely useful in determining whether traffic is easily travers-
Optimizing Performance by Server Roles
1423
ing the network. The greater the number of errors indicates that packets must be present,
causing more network traffic. If a high number of errors are persistent on the network,
throughput will suffer. This can be caused by a bad NIC, unreliable links, and so on.
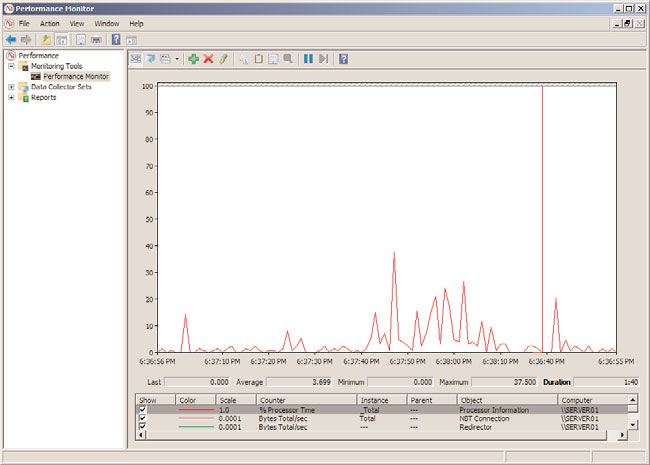
If network throughput appears to be slowing because of excessive traffic, keep a close watch
on the traffic being generated from network-based services such as the ones described in
Table 34.4. Figure 34.18 shows these items being recorded in Performance Monitor.
TABLE 34.4
Network-Based Service Counters Used to Monitor Network Traffic
Object
Counter
Description
Network
Current
Displays used bandwidth for the selected network adapter
Interface
Bandwidth
Server
Bytes Total/sec
Monitors the network traffic generated by the Server service
34
Redirector
Bytes Total/sec
Processes data bytes received for statistical calculations