Windows Server 2008 R2 Unleashed (275 page)
Read Windows Server 2008 R2 Unleashed Online
Authors: Noel Morimoto

. All home directories will be limited in size (for example, 500MB) per user.
. Users must either fill out the technical support Outlook form or request assistance
through the advertised help desk phone number.
1394
CHAPTER 34
Capacity Analysis and Performance Optimization
Policies and procedures, however, aren’t just for end users. They can also be established
and applied to IT personnel. In this scenario, policies and procedures can serve as guide-
lines for technical issues, rules of engagement, or an internal set of rules to abide by. The
following list provides some examples of policies and procedures that might be applied to
the IT department:
. System backups must include System State data and should be completed by 5:00
a.m. each workday, and restores should be tested frequently for accuracy and disaster
preparedness.
. Routine system maintenance should be performed only outside of normal business
hours, for example, weekdays between 8:00 p.m. and 12:00 a.m. or on weekends.
. Basic technical support requests should be attended to within two business days.
. Priority technical support requests should be attended to within four hours of the
request.
. Any planned downtime for servers should follow a change-control process and must
be approved by the IT director at least one week in advance with a five-day lead time
provided to those impacted by the change.
Benchmark Baselines
ptg
If you’ve begun defining policies and procedures, you’re already cutting down the number
of immeasurable variables and amount of empirical data that challenge your decision-
making process. The next step to prepare for capacity analysis is to begin gathering base-
line performance values. The Microsoft Baseline Security Analyzer (MBSA) is an example of
a tool that performs a security compliance scan against a predefined baseline.
Baselines give you a starting point with which you can compare results. For the most part,
determining baseline performance levels involves working with hard numbers that repre-
sent the health of a system. On the other hand, a few variables coincide with the statisti-
cal representations, such as workload characterization, vendor requirements or
recommendations, industry-recognized benchmarks, and the data that you collect.
Workload Characterization
Workloads are defined by how processes or tasks are grouped, the resources they require,
and the type of work being performed. Examples of how workloads can be characterized
include departmental functions, time of day, the type of processing required (such as batch
or real-time), companywide functions (such as payroll), volume of work, and much more.
It is unlikely that each system in your environment is a separate entity that has its own
workload characterization. Most, if not all, network environments have systems that
depend on other systems or are even intertwined among different workloads. This makes
workload characterization difficult at best.
So, why is workload characterization so important? Identifying systems’ workloads allows
you to determine the appropriate resource requirements for each of them. This way, you
can properly plan the resources according to the performance levels the workloads expect
and demand.
Using Capacity-Analysis Tools
1395
Benchmarks
Benchmarks are a means to measure the performance of a variety of products, including
operating systems, virtually all computer components, and even entire systems. Many
companies rely on benchmarks to gain competitive advantage because so many profes-
sionals rely on them to help determine what’s appropriate for their network environment.
As you would suspect, Sales and Marketing departments all too often exploit the bench-
mark results to sway IT professionals over their way. For this reason, it’s important to
investigate the benchmark results and the companies or organizations that produced the
results. Vendors, for the most part, are honest with the results, but it’s always a good idea
to check with other sources, especially if the results are suspicious. For example, if a
vendor has supplied benchmarks for a particular product, check to make sure that the
benchmarks are consistent with other benchmarks produced by third-party organizations
(such as magazines, benchmark organizations, and in-house testing labs). If none are avail-
able, you should try to gain insight from other IT professionals or run benchmarks on the
34
product yourself before implementing it in production.
Although some suspicion might arise from benchmarks because of the sales and marketing
techniques, the real purpose of benchmarks is to point out the performance levels that
you can expect when using the product. Benchmarks can be extremely beneficial for deci-
sion making, but they shouldn’t be your sole source for evaluating and measuring perfor-
ptg
mance. Use the benchmark results only as a guideline or starting point when consulting
benchmark results during capacity analysis. It’s also recommended that you pay close
attention to their interpretation.
Table 34.1 lists companies or organizations that provide benchmark statistics and bench-
mark-related information, and some also offer tools for evaluating product performance.
TABLE 34.1
Organizations That Provide Benchmarks
Company/Organization Name
Web Address
The Tolly Group
www.tollygroup.com
Transaction Processing
www.tpc.org/
Lionbridge (Veritest)
www.etestinglabs.com/
Computer Measurement Group
www.cmg.org/
Analyzing system capacity and performance requires a handful of tools and the knowledge
to use them properly to obtain valuable data. Windows Server 2008 R2 includes several
tools to assist with this initiative, and even more are available for download or purchase
1396
CHAPTER 34
Capacity Analysis and Performance Optimization
from Microsoft. In addition, several other companies also have performance and capacity-
analysis solutions available. Some of these tools are even capable of forecasting system
capacity, depending on the amount of information they are given.
A number of sizing tools exist from various companies. A sizing tool takes data relative to
the networking environment and returns recommended hardware configurations, usually
in a Microsoft Excel spreadsheet or similar reporting application. An example of one such
tool is the Microsoft Assessment and Planning (MAP) Toolkit for Windows Server 2008 R2.
This tool, available for download from Microsoft at http://technet.microsoft.com/en-us/
solutionaccelerators/dd537573.aspx, assists you when planning your migration to
Windows Server 2008 R2 by creating an inventory of your current server infrastructure;
therefore, you can determine hardware and device compatibility and Windows Server
2008 R2 readiness.
Another free tool offered from Microsoft is the Virtualization Solution Accelerators. For
example, the Microsoft Assessment and Planning (MAP) Toolkit for Hyper-V can be lever-
aged to accelerate your migration to Hyper-V on Windows Server 2008 R2 by identifying
underutilized servers within your infrastructure, which can be potential virtualization
candidates.
Microsoft also offers several useful utilities that are either inherent to Windows Server
2008 R2 or are sold as separate products. Some of these utilities are included with the
ptg
operating system, such as Task Manager, Network Monitor, Performance Monitor, and the
enhanced Event Viewer. Data that is collected from these applications can be exported to
other applications, such as Excel or Microsoft Access, for inventory and analysis. Other
Microsoft utilities like System Center Configuration Manager (SCCM) and System Center
Operations Manager (OpsMgr) can also be used; however, they are sold separately.
Task Manager
The Windows Server 2008 R2 Task Manager is similar to its Windows Server 2008 and
Windows Server 2003 predecessors in that it offers multifaceted functionality. You can
view and monitor processor, memory, application, network, services, user, and process-
related information in real time for a given system. This utility is a well-known favorite
among IT personnel and is great for getting a quick view of key system health indicators
with the lowest performance overhead.
To begin using Task Manager, use any of the following methods:
. Press Ctrl+Shift+Esc.
. Right-click on the taskbar and select Start Task Manager.
. Press Ctrl+Alt+Delete and then click Start Task Manager.
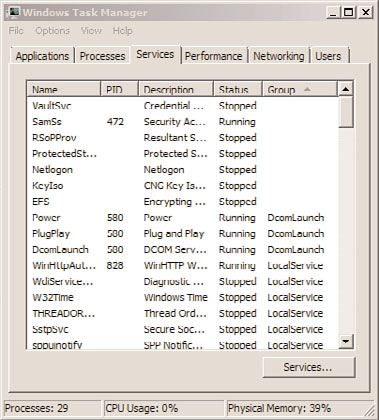
When you start Task Manager, you’ll see a screen similar to that shown in Figure 34.1.
Using Capacity-Analysis Tools
1397
34
FIGURE 34.1
Services tab in the Windows Server 2008 R2 Task Manager.
ptg
The Task Manager window contains the following six tabs:
.
Applications—
This tab lists the applications that are currently running. You can
start and end applications from this tab.
.
Processes—
On this tab, you can find performance metric information of the
processes currently running on the system. Sorting the processes by CPU or memory
usage will reveal which processes are consuming the most system resources.
.
Services—
A recent addition to Windows is the Services tab in Task Manager. As
shown in Figure 34.1, administrators can now see what services are running without
having to load Computer Management or the Services Management Console
(services.msc) separately.
.
Performance—
This tab can be a graphical or tabular representation of key system
parameters such as kernel usage, paging, CPU cycles, and more—in real time.
.
Networking—
This tab displays the network traffic coming to and from the
machine. The displayed network usage metric is a percentage of total available
network capacity for a particular adapter.
.
Users—
This tab displays users who are currently logged on to the system.
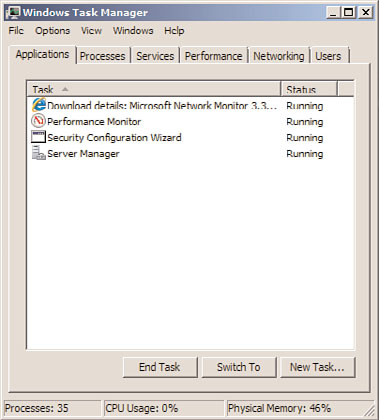
In addition to the Task Manager tabs, the Task Manager is, by default, configured with a
status bar at the bottom of the window. This status bar, shown in Figure 34.2, displays the
1398
CHAPTER 34
Capacity Analysis and Performance Optimization
number of running processes, CPU utilization percentage, and the amount of memory
currently being used.
ptg
FIGURE 34.2
Windows Server 2008 R2 Task Manager status bar.
As you can see, Task Manager presents a variety of valuable real-time performance infor-
mation. This tool is particularly useful for determining what processes or applications are
problematic and gives you an overall picture of system health with quick access to termi-
nate applications and processes, or identify potential bottlenecks.
There are limitations, however, which prevent it from becoming a useful tool for long-
term or historical analysis. For example, Task Manager can’t store collected performance
information for future analysis and viewing; it is capable of monitoring only certain
aspects of the system’s health, and the information that is displayed pertains only to the
local machine. For these reasons alone, Task Manager doesn’t make a prime candidate for