Understanding Sabermetrics (6 page)
Read Understanding Sabermetrics Online
Authors: Gabriel B. Costa,Michael R. Huber,John T. Saccoma

3. The 2006 World Champion St. Louis Cardinals had the following raw offensive numbers for the top starting player at each position:
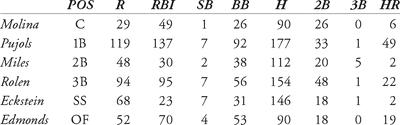
Calculate the HEQ-O for each player.
4. The 2006 World Champion St. Louis Cardinals had the following raw defensive numbers for the top starting player at each position:

Using the proper PMF, calculate the HEQ-D for each player.
5. Using the numbers computed in questions 3 and 4 above, calculate the PMT for each of the Cardinals starting players from 2006.
6. Calculate the TA for Pujols and Howard given the raw data below:

1. The American League in 1966 had a BA of .240, OBP of .306 and SLG of .369, while the 1954 NL numbers were .265, .335, and .407, respectively. Using the POP calculated in this chapter for Willie Mays and Frank Robinson, calculate their relative POP.
2. Barry Bonds’s 2001 season at bat is often compared to Babe Ruth’s season in 1921 for sheer dominance. Below are their numbers for the year, coupled with their league’s numbers:
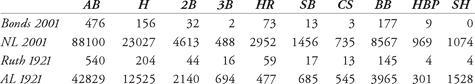
Some interesting observations about the chart
• The 2001 NL had exactly twice the number of teams as did the AL in 1921;
• The AL in 1921 batted a robust .292, while the NL in 2001 batted .261;
• The number of home runs and triples make for an interesting comparison, as do the number of sacrifice bunts (SH) and caught stealing (CS), all of which point to the different styles of play in these two leagues.
Calculate the TA for Ruth and Bonds, and their respective leagues, and then compute their relative TA. Note that the SF and GDP data, while available for NL 2001 and the two players, is not available for the AL in 1921. Thus, these quantities should be left out for all the computations in this problem.
3. Can the POP, TA and HEQ be combined in some way to form a new statistic that measures all-around play? Come up with such a statistic, and use it to compare Rickey Henderson and Gorman Thomas in 1982, and Albert Pujols and Ryan Howard in 2006.
FormulasHEQ-O (Hoban Effectiveness Quotient-Offense) = TB + R + RBI + SB + 0.5 (BB)
HEQ-D (Hoban Effectiveness Quotient-Defense): Based on defensive position (note — none for Pitcher)
C: (PO + 3A + 2 DP − 2 E) × (0.445) [0.445 is PMF, and PO are capped at 800]
1B: (0.25 PO + 3A + DP − 2 E) × (0.51) [0.51 is PMF]
2B, 3B, SS: (PO + A + DP − 2 E) × (PMF) [PMF
2b
= .46, PMF
ss
= .548, PMF
3b
= .888]
2b
= .46, PMF
ss
= .548, PMF
3b
= .888]
HEQ = HEQ-O + HEQ-D
PCT (Player Career Total): Average HEQ over 10 best seasons
TA (Total Average) = (TB + BB + HBP + SB) / (AB−H + SH + SF + CS + GIDP)
BOP (Base-Out-Percentage) = (TB + BB + HBP + SB+ SH + SF) / (AB − H + SH + SF + CS + GIDP)
Relative {stat}= (Player {stat})/(League {stat})
Inning 2: Peak versus Career Performances
In
The Bill James Historical Baseball Abstract
, the author compares and contrasts great players in many ways, using a number of sabermetrical measures to rank performances of Hall of Famers and All-Stars. One way James rates players is to consider their peak performances: statistics covering roughly a four- or five-year period in which the player posted his best statistics, the years not necessarily being consecutive. James also evaluates performances by considering how players performed throughout their careers, looking at, among other things, their accumulated statistical totals.
In this chapter we offer a systematic way to consider both types of performances. We note that evaluating the peak performance of an individual necessitates comparing him with his contemporaries. How one star performed relative to other stars of his era, may shed some light in comparing players of different times. In a sense, when looking at career ratings, one might only consider the players’ bottom-line career totals. However, it is important to put these numbers into proper context, historical and otherwise, when ranking the great players, past and present. This issue will be addressed in the chapter
Seventh-Inning Stretch: Non-Sabermetrical Factors
.
Seventh-Inning Stretch: Non-Sabermetrical Factors
.
There is a certain amount of subjectivity here, especially with regard to the selection of “peak” years. In the two figures below, we suggest methodologies to determine both peak and career values.
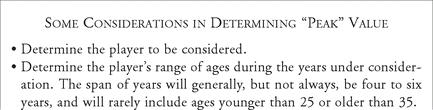
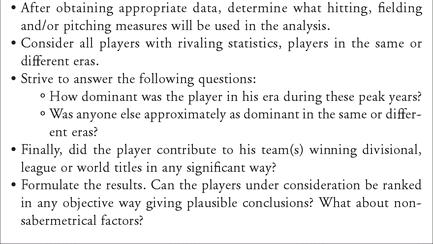
Figure 4.1. Determining “peak” value
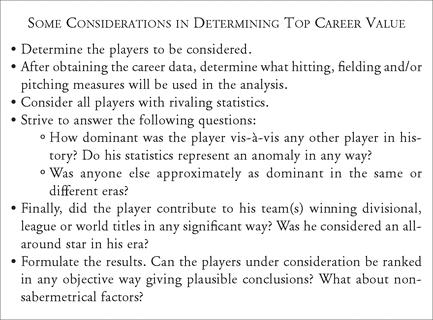
Figure 4.2. Determining “career” value
A player like Lou Gehrig, for instance, would have an extremely high peak value. In fact, over a ten year period, from 1927 through 1936, Gehrig’s production is nearly unrivaled. Due to his premature retirement, his career value is perhaps not as dominant, but it would be difficult to choose any other first baseman in history with greater career statistics.
Another argument for comparing peak versus career values has to do with the pinnacle of a player’s career, gaining entrance into the National Baseball Hall of Fame. Are there certain numbers which automatically qualify a player for the Hall? In the 1980s, if a player ended his career with 500 home runs or 3000 base hits or 300 pitching victories, most folks would say he was a lock for Cooperstown. The career totals for ballplayers would almost guarantee enough votes. Is this true today? Or, similarly, if a player has a fantastic peak season, relative to other players, is that enough to warrant a plaque in Cooperstown? We offer a few examples.
Let’s consider some offensive examples first. Roger Maris will always be known as the player who broke Babe Ruth’s single-season mark for total home runs. Of course, every argument about the 1961 season includes the notion that Maris’ Yankees played eight more games (162) than Ruth’s Yankees (154). Let’s contrast Roger Maris’ peak and career totals. In 1961, Roger played in 161 games. In 590 at-bats, he led the American League in runs (with 132), in home runs (with 61) and in runs batted in (with 142). His batting average was .269, his on-base percentage was .372, and his slugging percentage was .620. Does this qualify for a peak season? Roger was coming off of a good season in 1960, where he led the league in slugging (with .581) and RBI (with 112). He was named an outfielder on the Sporting News Major League All-Star Team in 1960, won a Gold Glove as right fielder that year, and won the league’s Most Valuable Player Award. He also hit 39 home runs, but that did not lead the league.
Other books
Perfect Ruin by Lauren DeStefano
Vintage (Adrenaline Series Book 2) by Neal, Xavier
Crash Pad by Whitley Gray
Miss Withers Regrets by Stuart Palmer
69 Barrow Street by Lawrence Block
Sweet as the Devil by Johnson, Susan
The Tragic Flaw by Che Parker
What Do Women Want? by Erica Jong
American Terrorist (The Rayna Tan Action Thrillers Book 1) by Wesley Robert Lowe