Understanding Sabermetrics (16 page)
Read Understanding Sabermetrics Online
Authors: Gabriel B. Costa,Michael R. Huber,John T. Saccoma

Hard Sliders
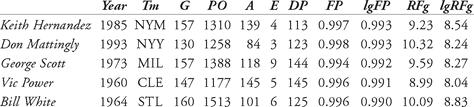
1. Eddie Murray is the only first baseman to win multiple Gold Glove Awards in the American League and be elected into the Hall of Fame. Compare the fielding runs of the players who have won seven or more Gold Glove Awards. Each is listed below with a season in which his fielding percentage was highest. Compare the fielding runs to each player’s batting runs for the season.
2. Fernando Valenzuela won both the Rookie of the Year Award and Cy Young Award in 1981 (and he placed 5th in the Most Valuable Player voting). Baseball writers often discuss the sophomore jinx; i.e., after a great rookie season, a player has a sub-par second year. Using the
Linear Weights Pitching Run
s, compare the rookie and sophomore seasons for the following National League pitchers: Valenzuela (1981, 1982), Dwight Gooden (1984, 1985), Hideo Nomo (1995, 1996), and Dontrelle Willis (2003, 2004).
Linear Weights Pitching Run
s, compare the rookie and sophomore seasons for the following National League pitchers: Valenzuela (1981, 1982), Dwight Gooden (1984, 1985), Hideo Nomo (1995, 1996), and Dontrelle Willis (2003, 2004).
Inning 6: The Runs-Created School
In Inning 4, we explored Pete Palmer’s linear-weights system to analyze a player’s offensive performance. The model is based on how many runs beyond average that a player produces. Thus, an average player scored zero, and below average players have negative linear weights.
In the 1970s, a night watchman at the Stokely Van Camp factory in Lawrence, Kansas, studied baseball box scores long into the night. His name was Bill James, and his self-published books filled with his findings and occasional iconoclastic rants won him a small but loyal following. His yearly books, entitled
The Baseball Abstract
, started being published for a mass audience in 1982.
The Baseball Abstract
, started being published for a mass audience in 1982.
He determined that the primary purpose of an offense is the creation of runs, and sought formulas that best described how many runs a particular player can be credited as having created.
In his 1985
Baseball Abstract,
James set forth his offensive philosophy in axiomatic form:
Baseball Abstract,
James set forth his offensive philosophy in axiomatic form:
• Axiom I: A ballplayer’s purpose in playing baseball is to do those things which create wins for his team, while avoiding those things which create losses for his team.
• Axiom II: Wins result from runs scored. Losses result from runs allowed.
• First Corollary to Axiom II: An offensive player’s job is to create runs for his team.
James quantified the relationship stated in Axiom 2 with the Pythagorean Record, a formula that predicts winning percentage based solely on runs scored by a team and runs allowed.
The Pythagorean Record is
 where
where
RS
is the number of runs a team has scored and
RA
is the number that it has allowed. The exponent
x
is an as yet undetermined quantity. In the formula’s earliest incarnation, James used
x
= 2 as the exponent, but other formulas exist that change the exponent in such a way to improve the accuracy of the projection. Some of these include
x
= 1.81,
x
= 1.83, or
x
to be determined by a formula that incorporates the team’s runs scored and allowed.
whereRS
is the number of runs a team has scored and
RA
is the number that it has allowed. The exponent
x
is an as yet undetermined quantity. In the formula’s earliest incarnation, James used
x
= 2 as the exponent, but other formulas exist that change the exponent in such a way to improve the accuracy of the projection. Some of these include
x
= 1.81,
x
= 1.83, or
x
to be determined by a formula that incorporates the team’s runs scored and allowed.
The 1969 San Francisco Giants had a record of 92-70, a winning percentage of .556. They scored 713 runs while allowing 636. Using the Pythagorean Record with
x
= 2, i.e.,
 , we have
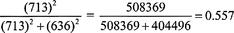 .
.
x
= 2, i.e.,
, we have.The 1969 Houston Astros scored 8 more runs than they allowed during the season, 676 to 668, the smallest margin in the NL that year. For Houston, these totals predict a winning percentage of
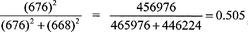 , which translated to 82 (actually, 81.9) wins in a 162 game season. The Astros in 1969 were 81-81.
Using this formula, it would be mathematically impossible for a team that scores more runs than it allows to have a winning percentage below .500, and a team that scores fewer runs than it allows to have a winning percentage above .500. Of course, this could happen in real life, and in fact, this formula can serve as a testament to (or an indictment of ) the abilities of the team’s manager to influence his team’s record.
In 1969, only three teams outplayed their Pythagorean Records, and three others were less than one win below it. Two teams were more than 6 wins better, the eventual World Champion Mets, managed by Gil Hodges, and the expansion San Diego Padres, managed by Preston Gomez. The Dodgers, managed by Walter Alston, were the most wins (7) below the projection for the year.
Runs CreatedIn order to get a feel for how many runs a player can be credited with actually having produced, Bill James devised a model called runs created (RC). The most basic version of the runs created formula is
 Beautiful in its simplicity, this formula can predict effectively the number of runs a league will score in a given season. This model usually predicts a run total within several percent of the actual total. In many of baseball’s earliest seasons, the four quantities needed for this formula are the only ones available.
In 1986, the 12 teams in the National League scored a total of 8096 runs.
The four quantities in the RC formula were
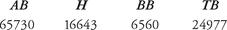
Table 8.1 The 1986 NL totals
Thus, we have
 which is within 1 percent of the actual run total.
which is within 1 percent of the actual run total.Alternatively, this can be computed as OB × SLG × AB, or OB × TB.
James stated the following as a “Known Principle of Sabermetrics”:
• There are two essential elements to an offense: its ability to get on base, and its ability to advance runners.
In the RC, the first part of the numerator, the H + BB, is the “on base” portion of the formula, while the second part of the numerator, the TB, represents the “advancement” part. The denominator is roughly the number of opportunities.
Note that there are elements an offense not included in the RC formula. For that reason, we will refer to this version as basic runs created (BRC).
Other books
The Shape of Snakes by Minette Walters
The Ballad of Frankie Silver by Sharyn McCrumb
The Bomber Boys by Travis L. Ayres
Scent of Magic by Clark, Lori L
Try Try Again by Terence Kuch
Her Adoring SEAL (Midnight Delta Book 3) by Caitlyn O'Leary
Amorelle by Grace Livingston Hill
Knight's Gambit by William Faulkner
Getting Wet by Zenina Masters
The Assassins of Tamurin by S. D. Tower