Understanding Business Accounting For Dummies, 2nd Edition (32 page)
Read Understanding Business Accounting For Dummies, 2nd Edition Online
Authors: Colin Barrow,John A. Tracy
Tags: #Finance, #Business

Suppose you have held an investment for some time - say, 5, 10, or 20 years. Your ROI rate probably has fluctuated from year to year, high in some years and low in others. Now, suppose we ask how you have done on this investment over the years. You could give us the yearly ROI rates. But the more common practice in the investment world is to calculate the
average
ROI - the equivalent constant, or flat rate that would have resulted in the same ending value of your investment.
Average ROI
rates are commonly used to summarise the historical investment performance of a mutual fund. You see this measure in several other places as well - for example, in the reporting of investment performance to individuals by their retirement fund managers. Be very careful about using these ROI rates. Keep in mind that the average ROI rate masks the actual year-by-year volatility in investment performance.
For example, suppose that five years ago you put £100,000 in an investment that paid no cash income any year; all the return was in annual changes in the value of the investment. Figure 4-4 summarises the yearly performance of your investment. Your £100,000 original investment five years ago is now worth £248,832. But the annual returns fluctuated widely; you had some good ROI years and some bad years. (Many investors would not tolerate the annual ROI volatility of this type of investment.) What is the average annual ROI for your investment?
Figure 4-4:
Yearly investment perform-ance over five years.
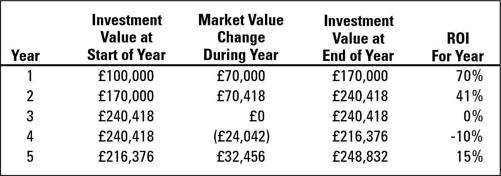
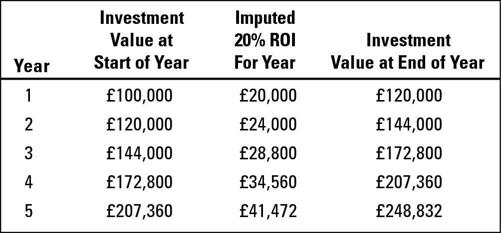
Believe it or not, the average ROI for this investment is 20 per cent. You may ask: How can this be correct? Well, 20 per cent is indeed correct. The average annual ROI rate is the uniform rate that would make the investment grow from the original amount invested (£100,000 in this example) to the final value at the end of the investment (£248,832 in this example). You may not be convinced that the average annual ROI rate is 20 per cent unless you actually walk through what would have happened if your investment had increased 20 per cent in value each year.
Figure 4-5 shows this imaginary year-by-year investment value growth. Note that the investment value at the end of the fifth year is exactly £248,832. Of course, you didn't actually earn 20 per cent ROI each year, as a comparison with the actual investment performance in Figure 4-4 reveals. But advertising that the average annual ROI for this investment is 20 per cent is legal and even accurate. Let the investor beware!
The Move Channel has a sophisticated online ROI calculator that you can find at
www.themovechannel.com/calculators/roi.asp
. The calculator is designed with property investors in mind, but works equally as well with all types of investment. Just substitute their terms, rent, refurbishment costs, and so forth, with your own.
Figure 4-5:
Proof that the average annual ROI rate for the five-year investment is 20 per cent.
An Accounting Template for Retirement Planning
The main financial concern of most people as they approach retirement is whether they will have enough retirement income in addition to what they will receive from the state pension. How much retirement income do you need? How should you take money out of your retirement account, assuming that you have choices? What are the income tax effects of withdrawals from your tax-deferred retirement funds?
We can't begin to answer these questions here. But we can offer a basic template to get you going and to help you negotiate the first steps in financial retirement planning. Figure 4-6 illustrates how to calculate your
replacement ratio,
which you compute by dividing retirement income by pre-retirement income. The point is that your retirement income replaces your wage, or salary, or other earned income, and that it's very important to calibrate your retirement income as a percentage of your pre-retirement income. Most financial advisers recommend that your replacement ratio should be at least 70 per cent, in order to maintain your standard of living at a reasonably comparable level.
For this example, we used numbers based on reasonable assumptions and typical conditions. Prior to retirement, Pat (as we call the person in this example) was earning £6,000 per month. Upon retirement, this regular pay cheque stops coming. Pat has to depend on either the company's pension plan (in a defined-benefit retirement plan) or on the accumulated investment amount (in a defined-contribution plan). Without going into details, assume that Pat's monthly retirement income will be £3,960 per month, which is two thirds of Pat's pre-retirement income. But hold on; you have to consider several other important factors.
Figure 4-6:
Accounting template for figuring retirement income replacement ratio.
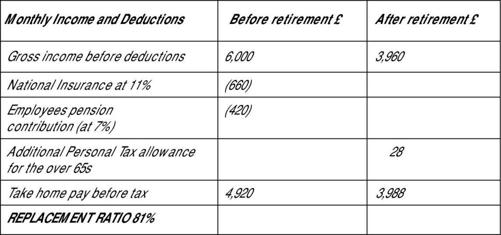
In 2008, an employee has to pay 11 per cent National Insurance tax on the first £30,000 (approx) of annual earned income. Once retired, Pat doesn't have to pay the tax; instead Pat starts receiving state pension income, which is about £520 per month for a married man. Pat also stops making pension contributions. The bottom line is that Pat's take-home monthly income, before income tax, is £3,988 after retirement and £4,920 before retirement - which is a replacement ratio of 81 per cent. Most financial advisers consider this ratio adequate, although it would be better, of course, if Pat's retirement nest egg had been bigger to provide more income during the golden years. The template shown in Figure 4-6 allows you to start with a replacement ratio goal, say 85 per cent, and then work back to how much your retirement income would have to be. Good luck on accumulating enough in your retirement fund to provide the income you need.
www.pensioncalculator.org.uk
.
Part II
In this part . . .
F
inancial statements are like the tip of an iceberg - they only show the visible part, underneath which are a lot of record-keeping, accounting methods, and reporting decisions. The managers of a business, the investors in a business, and the lenders to a business need a firm grasp on these accounting communications. They need to know which handles to grab hold of and how to find both the good and bad signals in financial statements - and, ugh, this includes the small-print footnotes that go with financial statements.
Accountants prepare three primary financial statements. The profit and loss account reports the profit-making activities of the business and how much profit or loss the business made. (Sounds odd, doesn't it, to say a business made a loss? But to make profit, a business has to take the risk that it may suffer a loss.) The balance sheet reports the financial situation and position of the business at a point in time - usually the last day of the profit period. The cash flow statement reports how much cash was actually realised from profit and other sources of cash, and what the business did with this money. In short, the financial life of a business and its prospects for success or potential danger of failing is all revealed in its financial statements, as this part of the book exposes.