The Price of Civilization: Reawakening American Virtue and Prosperity (30 page)
Read The Price of Civilization: Reawakening American Virtue and Prosperity Online
Authors: Jeffrey D. Sachs
Tags: #Business & Economics, #Economic Conditions, #History, #United States, #21st Century, #Social Science, #Poverty & Homelessness

True health care reform, the kind that not only expands coverage but actually reduces America’s bloated costs, could probably save as much as 1 percent of GDP per year in net budgetary outlays (lower spending and higher taxes) in reforms carried out over several years. This budget saving would reflect a combination of lower direct outlays for government-provided health care (such as Medicare) and a cutback on the deductibility of private health insurance, especially of high-cost plans purchased by high-income individuals.
This leaves one more part of the budget: the military. Here the prospects for budget savings are even brighter. The Iraq and Afghanistan occupations currently bloat the military budget by around 1 percent of GDP. Another 1.5 percent of GDP could certainly be cut back on procurement of unneeded nuclear weapons and other weapons, and a scaling back of international military bases. The military budget could be trimmed to around 2.5 percent of GDP by 2015, which is 1.5 percent of GDP less than in the baseline that I just outlined.
In total, cutting military outlays to 2.5 percent of GDP would reduce the baseline deficit to 4.5 percent of GDP in 2015. Another 0.5 percent of GDP could be saved in areas identified by the deficit commission and another 1 percent on true health care reform. In total, we might trim around 3 percent of GDP from the baseline deficit in these categories, leaving a 2015 deficit of some 3 percent of GDP.
Yet that is not the end of the story. We have not yet factored in the need to
augment
certain spending programs even as we cut others. According to the discussion in the preceding chapter, we need to
increase
outlays on certain public goods. The list from the preceding chapter is as follows, together with my rough estimate of the
additional
spending that is needed as a percentage of GDP:
- Job training, job matching, and other active labor market policies, 0.5 percent
- Primary and secondary schools, 0.3 percent
- Higher education, 0.4 percent
- Child care and early childhood development, 0.5 percent
- Modernization of infrastructure, 1 percent
- Research and development, 0.3 percent
- Diplomacy and foreign assistance, 0.5 percent
This suggests that the current spending needs to be
augmented
by around 3.5 percent of GDP in order to meet the vital challenges of jobs, schooling, early childhood development, infrastructure, and international affairs. Let’s be conservative and round down to 3 percent of GDP in the added outlays needed to address the country’s structural challenges in education, infrastructure, science, and other areas.
The upshot is the following: We start with a baseline structural budget deficit of 6 percent of GDP. We can identify justified savings of perhaps 3 percent of GDP from that in spending, mainly by cuts in the military and reductions in health care costs. But we must add back another 3 percent of GDP in spending to increase the supply of public goods. The chronic financing gap for mid-decade (2015) is therefore on the order of 6 percent of GDP, taking into account the
plausible cuts in existing programs plus the plausible need to expand other programs
.
In this scenario, total federal spending would settle at around 24 percent of GDP in 2015, compared with revenues of around 18
percent. No doubt those are rough numbers in need of refinement. Still, they point us to the essential conclusion: that the United States will need substantially more revenues to close the budget deficit, especially recognizing the need to increase federal spending in certain critical areas.
I have been relatively conservative in the added spending that is needed. These projections do not make room for any significant transfer of income to relieve poverty, offer new housing assistance, or cover a jump in interest rates on the public debt. They assume that defense outlays as a share of GDP can be reduced by half of the current level, from 5 percent to 2.5 percent, an approach that will certainly be resisted by the Pentagon and many key interest groups. If these assumptions are too optimistic, the budget deficit in 2015 is likely to be much larger than estimated, with the need for even more stringent measures to raise revenues or cut spending.
Let me add a final note on the work of the Obama deficit commission. The deficit commission assumed that total spending and revenues could settle at 21 percent of GDP. It did so because it utterly neglected the need for existing, much less new, civilian spending in key areas such as infrastructure, education, training, and R&D. It is relatively easy to balance the budget if one presumes that new kinds of public spending are not needed. Yet that is no way to pay for civilization.
Budget Lessons from Abroad
All of this discussion prompts a crucial question: how do Canada, Denmark, Norway, Sweden, and other countries manage to educate their young, fight poverty, modernize their infrastructure, enjoy a life expectancy well above America’s, and still maintain a budget that is more in balance than America’s? After all, in 2010, the United States had the second-largest budget deficit as a share of GDP among the high-income countries, ahead of only Ireland (see
Figure 11.3
). The social democratic economies of northern Europe, where government plays a much larger role in the economy, had deficits under 3 percent of GDP in Denmark, Finland, and Sweden, with a surplus of 10 percent of GDP in Norway, achieved mainly by saving a considerable fraction of its oil and gas revenues for the benefit of later generations.
Figure 11.3: Budget Deficit in OECD Nations as Percentage of GDP, 2010
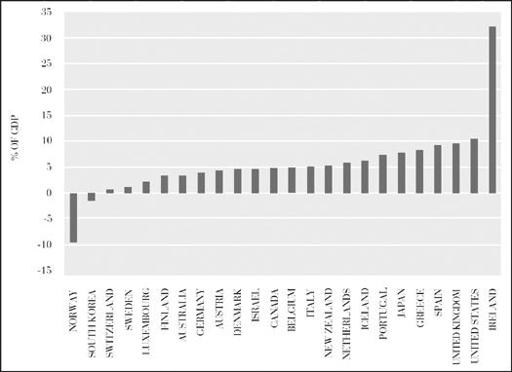
Source: Data from OECD.
The answer, of course, is that the other countries tax their citizens more heavily in order to supply more public goods, including, in the case of Scandinavia, universal access to health care, higher education, and child care and support for families with young children. The comparison in tax collections is shown in
Figure 11.4
. The United States has the second lowest tax revenues as a share of GDP among all of the countries shown, just slightly larger than Australia. We see that the countries in deepest budget crisis in 2010 were not those with among the lowest nor the highest government spending, but those with the lowest tax revenues: Greece, Ireland, Portugal, Spain, the United Kingdom, and the United States. All these countries are running enormous budget deficits. They seek to provide public services and income transfers but are not willing to pay for them through public revenues.
Figure 11.4: Tax Revenues as a Percentage of GDP for OECD Nations, 2009
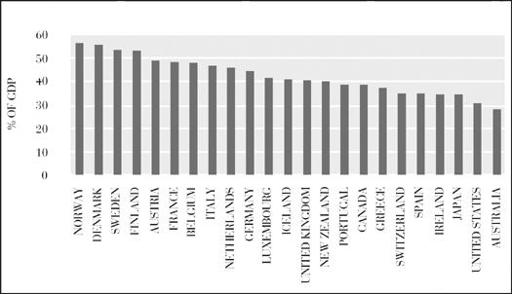
Source: Data from OECD Statistics Database.
To understand America’s budget predicament, it is useful to examine the changes in tax revenues as a share of GDP that have taken place in the United States and other high-income countries since the early 1960s. Half a century ago, both the United States and European countries had a similar level of total taxes relative to GDP, roughly 30 percent (counting national, state, and local taxes). In the United States, that level has remained roughly unchanged for five decades. In Europe, taxes as a share of GDP have risen by around 10 percentage points on average. These changes are shown in
Figure 11.5
, which measures the rise in revenues relative to GDP, comparing 1965 and 2009. In the United States, there has been essentially no change in the tax-to-GDP ratio since 1965. In Europe, the tax-to-GDP ratio has risen in all countries, by 5 to 20 percentage points of GDP. Europe has used that rise in tax revenues to pay for a more extensive range of public services, as shown in
Figure 11.6
: education, family allowances, universal health care, and modernized infrastructure. It has also used the higher revenues in general to keep the budget deficit under control.
Figure 11.5: Change in Tax-to-GDP Ratio Between 1965 and 2009 for OECD
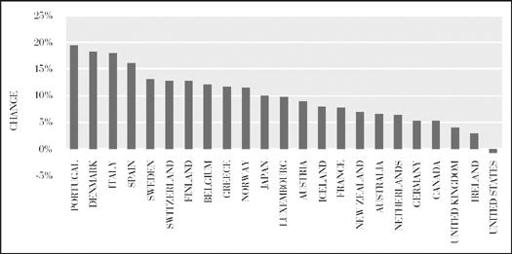
Source: Data from OECD Statistics Database.
The divergence between the United States and Europe reflects a divergence both of fiscal means and of fiscal ends. Though Europe generally has higher tax rates on all kinds of income, the biggest difference with the United States is that European countries all have a value-added tax (VAT) as a cornerstone of the budget. In Europe, the VAT routinely collects around 10 percent of GDP. In the United States, by contrast, the federal budget collects less than 1 percent of GDP in excise taxes akin to the VAT. This is the main difference in the fiscal means.
Figure 11.6: Gross Public Social Spending as a Percentage of GDP, 2010
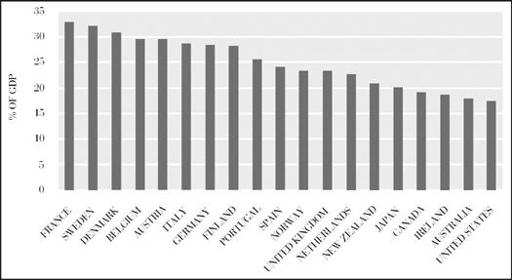
Source: Data from OECD Social Database.
The main difference in the fiscal ends is a divergence in the vision of government in the United States and Europe. In the United States, the anti-government politics that became the dominant political thrust of the last thirty years blocked an increase in total tax collections as a share of GDP. The United States therefore cut back on public investments in education, science, energy, and infrastructure, and squeezed outlays for the poor, just when they were most urgently needed.
Anti-tax ideologues in the United States claim that Europe pays a heavy price because of its higher taxes. This is hard to swallow, however, given that northern Europe is ahead of the United States on most indicators of material well-being: educational performance, subjective well-being, poverty rates, life expectancy, and so forth. Yes, it’s true that GDP per person is still higher in the United States than in most of Europe (though not higher than in Norway, for example), but that really doesn’t prove much about taxes or even about social well-being. U.S. GDP per person may be higher, but the average living standard of the median citizen is not: much of America’s higher GDP reflects higher health care costs, longer work hours and less leisure time, longer commutes, more military spending, and a high proportion of income at the very top of the income curve.
More important, the higher GDP per person predates any differences in tax systems, stretching back to the late nineteenth century. In 1913, for example, America was 52 percent richer than Western Europe, and in 1998, it was also 52 percent richer than Europe.
19
America’s long-standing advantage in GDP per person has been in its geography rather than its economic system. America has vastly more land and natural resources per person than Europe does. This has been the source of its enduring advantage (just as Norway’s high oil and gas earnings account for its higher GDP per
person than in the United States). Americans have bigger houses, bigger farms, and bigger cars, not to mention more natural capital per person in the form of oil, gas, and coal. These have been the sources of America’s higher income per person stretching back to the nineteenth century.