The Better Angels of Our Nature: Why Violence Has Declined (51 page)
Read The Better Angels of Our Nature: Why Violence Has Declined Online
Authors: Steven Pinker
Tags: #Sociology, #Psychology, #Science, #Amazon.com, #21st Century, #Crime, #Anthropology, #Social History, #Retail, #Criminology

BOOK: The Better Angels of Our Nature: Why Violence Has Declined
2.85Mb size Format: txt, pdf, ePub
Let’s start with the clashes of the titans—the wars with at least one great power on each side. Among them are what Levy called “general wars” but which could also be called “world wars,” at least in the sense that World War I deserves that name—not that the fighting spanned the globe, but that it embroiled most of the world’s great powers. These include the Thirty Years’ War (1618–48; six of the seven great powers), the Dutch War of Louis XIV (1672–78; six of seven), the War of the League of Augsburg (1688–97; five of seven), the War of the Spanish Succession (1701–13; five of six), the War of the Austrian Succession (1739–48; six of six), the Seven Years’ War (1755–63; six of six), and the French Revolutionary and Napoleonic Wars (1792–1815; six of six), together with the two world wars. There are more than fifty other wars in which two or more great powers faced off.
One indication of the impact of war in different eras is the percentage of time that people had to endure wars between great powers, with their disruptions, sacrifices, and changes in priorities. Figure 5–12 shows the percentage of years in each quarter-century that saw the great powers of the day at war. In two of the early quarter-centuries (1550–75 and 1625–50), the line bumps up against the ceiling: great powers fought each other in all 25 of the 25 years. These periods were saturated with the horrendous European Wars of Religion, including the First Huguenot War and the Thirty Years’ War. From there the trend is unmistakably downward. Great powers fought each other for less of the time as the centuries proceeded, though with a few partial reversals, including the quarters with the French Revolutionary and Napoleonic Wars and with the two world wars. At the toe of the graph on the right one can see the first signs of the Long Peace. The quarter-century from 1950 to 1975 had one war between the great powers (the Korean War, from 1950 to 1953, with the United States and China on opposite sides), and there has not been once since.
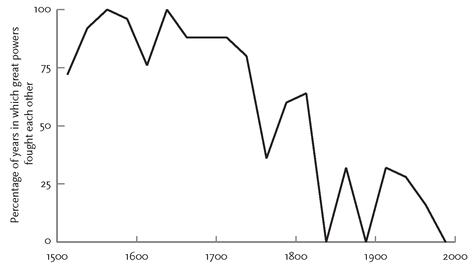
FIGURE 5–12.
Percentage of years in which the great powers fought one another, 1500–2000
Percentage of years in which the great powers fought one another, 1500–2000
Source:
Graph adapted from Levy & Thompson, 2011. Data are aggregated over 25-year periods.
Graph adapted from Levy & Thompson, 2011. Data are aggregated over 25-year periods.
Now let’s zoom out and look at a wider view of war: the hundred-plus wars with a great power on one side and any country whatsoever, great or not, on the other.
83
With this larger dataset we can unpack the years-at-war measure from the previous graph into two dimensions. The first is frequency. Figure 5–13 plots how many wars were fought in each quarter-century. Once again we see a decline over the five centuries: the great powers have become less and less likely to fall into wars. During the last quarter of the 20th, only four wars met Levy’s criteria: the two wars between China and Vietnam (1979 and 1987), the UNSANCTIONED war to reverse Iraq’s invasion of Kuwait (1991), and NATO’s bombing of Yugoslavia to halt its displacement of ethnic Albanians in Kosovo (1999).
The second dimension is duration. Figure 5–14 shows how long, on average, these wars dragged on. Once again the trend is downward, though with a spike around the middle of the 17th century. This is not a simpleminded consequence of counting the Thirty Years’ War as lasting exactly thirty years; following the practice of other historians, Levy divided it into four more circumscribed wars. Even after that slicing, the Wars of Religion in that era were brutally long. But from then on the great powers sought to end their wars soon after beginning them, culminating in the last quarter of the 20th century, when the four wars involving great powers lasted an average of 97 days.
84
84
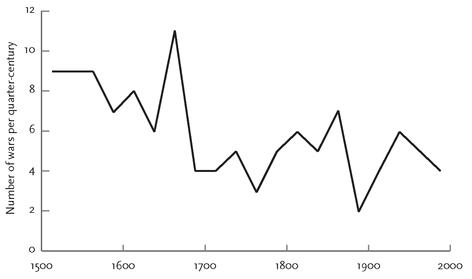
FIGURE 5–13.
Frequency of wars involving the great powers, 1500–2000
Frequency of wars involving the great powers, 1500–2000
Sources:
Graph from Levy, 1983, except the last point, which is based on the Correlates of War InterState War Dataset, 1816–1997, Sarkees, 2000, and, for 1997–99, the PRIO Battle Deaths Dataset 1946–2008, Lacina & Gleditsch, 2005. Data are aggregated over 25-year periods.
Graph from Levy, 1983, except the last point, which is based on the Correlates of War InterState War Dataset, 1816–1997, Sarkees, 2000, and, for 1997–99, the PRIO Battle Deaths Dataset 1946–2008, Lacina & Gleditsch, 2005. Data are aggregated over 25-year periods.
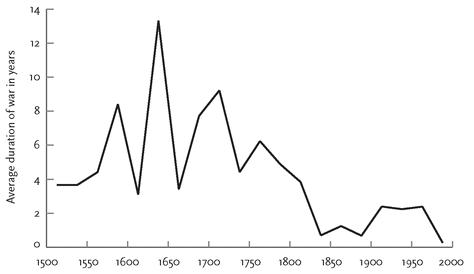
FIGURE 5–14.
Duration of wars involving the great powers, 1500–2000
Duration of wars involving the great powers, 1500–2000
Sources:
Graph from Levy, 1983, except the last point, which is based on the Correlates of War InterState War Dataset, 1816–1997, Sarkees, 2000, and, for 1997–99, the PRIO Battle Deaths Dataset 1946–2008, Lacina & Gleditsch, 2005. Data are aggregated over 25-year periods.
Graph from Levy, 1983, except the last point, which is based on the Correlates of War InterState War Dataset, 1816–1997, Sarkees, 2000, and, for 1997–99, the PRIO Battle Deaths Dataset 1946–2008, Lacina & Gleditsch, 2005. Data are aggregated over 25-year periods.
What about destructiveness? Figure 5–15 plots the log of the number of battle deaths in the wars fought by at least one great power. The loss of life rises from 1500 through the beginning of the 19th century, bounces downward in the rest of that century, resumes its climb through the two world wars, and then plunges precipitously during the second half of the 20th century. One gets an impression that over most of the half-millennium, the wars that did take place were getting more destructive, presumably because of advances in military technology and organization. If so, the crossing trends—fewer wars, but more destructive wars—would be consistent with Richardson’s conjecture, though stretched out over a fivefold greater time span.
We can’t prove that this is what we’re seeing, because figure 5–15 folds together the frequency of wars and their magnitudes, but Levy suggests that pure destructiveness can be separated out in a measure he calls “concentration,” namely the damage a conflict causes per nation per year of war. Figure 5–16 plots this measure. In this graph the steady increase in the deadliness of great power wars through World War II is more apparent, because it is not hidden by the paucity of those wars in the later 19th century. What is striking about the latter half of the 20th century is the sudden reversal of the crisscrossing trends of the 450 years preceding it. The late 20th century was unique in seeing declines both in the number of great power wars
and
in the killing power of each one—a pair of downslopes that captures the war-aversion of the Long Peace. Before we turn from statistics to narratives in order to understand the events behind these trends, let’s be sure they can be seen in a wider view of the trajectory of war.
and
in the killing power of each one—a pair of downslopes that captures the war-aversion of the Long Peace. Before we turn from statistics to narratives in order to understand the events behind these trends, let’s be sure they can be seen in a wider view of the trajectory of war.
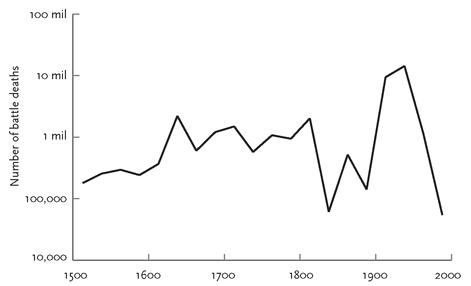
FIGURE 5–15.
Deaths in wars involving the great powers, 1500–2000
Deaths in wars involving the great powers, 1500–2000
Sources:
Graph from Levy, 1983, except the last point, which is based on the Correlates of War InterState War Dataset, 1816–1997, Sarkees, 2000, and, for 1997–99, the PRIO Battle Deaths Dataset 1946–2008, Lacina & Gleditsch, 2005. Data are aggregated over 25-year periods.
Graph from Levy, 1983, except the last point, which is based on the Correlates of War InterState War Dataset, 1816–1997, Sarkees, 2000, and, for 1997–99, the PRIO Battle Deaths Dataset 1946–2008, Lacina & Gleditsch, 2005. Data are aggregated over 25-year periods.
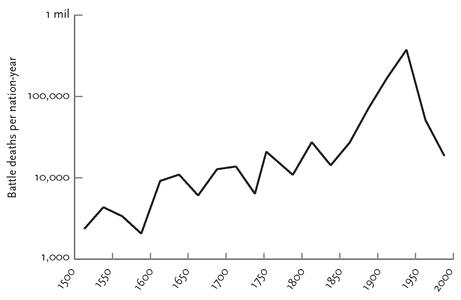
FIGURE 5–16.
Concentration of deaths in wars involving the great powers, 1500–2000
Concentration of deaths in wars involving the great powers, 1500–2000
Sources:
Graph from Levy, 1983, except the last point, which is based on the Correlates of War InterState War Dataset, 1816–1997, Sarkees, 2000, and, for 1997–99, the PRIO Battle Deaths Dataset 1946–2008, Lacina & Gleditsch, 2005. Data are aggregated over 25-year periods.
THE TRAJECTORY OF EUROPEAN WARGraph from Levy, 1983, except the last point, which is based on the Correlates of War InterState War Dataset, 1816–1997, Sarkees, 2000, and, for 1997–99, the PRIO Battle Deaths Dataset 1946–2008, Lacina & Gleditsch, 2005. Data are aggregated over 25-year periods.
Wars involving great powers offer a circumscribed but consequential theater in which we can look at historical trends in war. Another such theater is Europe. Not only is it the continent with the most extensive data on wartime fatalities, but it has had an outsize influence on the world as a whole. During the past half-millennium, much of the world has been part of a European empire, and the remaining parts have fought wars with those empires. And trends in war and peace, no less than in other spheres of human activity such as technology, fashion, and ideas, often originated in Europe and spilled out to the rest of the world.
The extensive historical data from Europe also give us an opportunity to broaden our view of organized conflict from interstate wars involving the great powers to wars between less powerful nations, conflicts that miss the thousand-death cutoff, civil wars, and genocides, together with deaths of civilians from famine and disease. What kind of picture do we get if we aggregate these other forms of violence—the tall spine of little conflicts as well as the long tail of big ones?
The political scientist Peter Brecke is compiling the ultimate inventory of deadly quarrels, which he calls the Conflict Catalog.
85
His goal is to amalgamate every scrap of information on armed conflict in the entire corpus of recorded history since 1400. Brecke began by merging the lists of wars assembled by Richardson, Wright, Sorokin, Eckhardt, the Correlates of War Project, the historian Evan Luard, and the political scientist Kalevi Holsti. Most have a high threshold for including a conflict and legalistic criteria for what counts as a state. Brecke loosened the criteria to include any recorded conflict that had as few as thirty-two fatalities in a year (magnitude 1.5 on the Richardson scale) and that involved any political unit that exercised effective sovereignty over a territory. He then went to the library and scoured the histories and atlases, including many published in other countries and languages. As we would expect from the power-law distribution, loosening the criteria brought in not just a few cases at the margins but a flood of them: Brecke discovered at least three times as many conflicts as had been listed in all the previous datasets combined. The Conflict Catalog so far contains 4,560 conflicts that took place between 1400 CE and 2000 CE (3,700 of which have been entered into a spreadsheet), and it will eventually contain 6,000. About a third of them have estimates of the number of fatalities, which Brecke divides into military deaths (soldiers killed in battle) and total deaths (which includes the indirect deaths of civilians from war-caused starvation and disease). Brecke kindly provided me with the dataset as it stood in 2010.
Other books
The Divine Economy of Salvation by Priscila Uppal
Rouse Up O Young Men of the New Age! by Kenzaburo Oe
Vampire in Atlantis by Alyssa Day
All In: Betting on a Full House (Gambling With Love) by Lane Hart
Stop the Clock by Alison Mercer
Blue Blue Eyes: Crime Novel by Helena Anderson
Scruples by Judith Krantz
The Red Planet by Charles Chilton
Shared Between Them by Korey Mae Johnson
The Fatal Crown by Ellen Jones
