Read The Bell Curve: Intelligence and Class Structure in American Life Online
Authors: Richard J. Herrnstein,Charles A. Murray
Tags: #History, #Science, #General, #Psychology, #Sociology, #Genetics & Genomics, #Life Sciences, #Social Science, #Educational Psychology, #Intelligence Levels - United States, #Nature and Nurture, #United States, #Education, #Political Science, #Intelligence Levels - Social Aspects - United States, #Intellect, #Intelligence Levels
The Bell Curve: Intelligence and Class Structure in American Life (48 page)

It is not good enough to accept without question that a general “background radiation” of bias, uniform and ubiquitous, explains away black
and white differences in test scores and performance measures. The hypothesis might, in theory, be true. But given the degree to which everyday experience suggests that the environment confronting blacks in different sectors of American life is not uniformly hostile and given the consistency in results from a wide variety of cognitive measures, assuming that the hypothesis is true represents a considerably longer leap of faith than the much more limited assumption that race prejudice is still a factor in American life. In the matter of test bias, this brings us to the frontier of knowledge.
This question has two different answers depending on how the question is understood, and confusion is rampant. We will take up the two answers and their associated rationales separately:
First version:
If you extract the effects of socioeconomic class, what happens to the overall magnitude of the B/W difference?
Blacks are disproportionately in the lower socioeconomic classes, and socioeconomic class is known to be associated with IQ. Therefore, many people suggest, part of what appears to be an ethnic difference in IQ scores is actually a socioeconomic difference.
The answer to this version of the question is that the size of the gap shrinks when socioeconomic status is statistically extracted. The NLSY gives a result typical of such analyses. The B/W difference in the NLSY is 1.21. In a regression equation in which both race and socioeconomic background are entered, the difference between whites and blacks shrinks to .76 standard deviation.
40
Socioeconomic status explains 37 percent of the original B/W difference. This relationship is in line with the results from many other studies.
41
The difficulty comes in interpreting what it means to “control” for socioeconomic status. Matching the status of the groups is usually justified on the grounds that the scores people earn are caused to some extent by their socioeconomic status, so if we want to see the “real” or “authentic” difference between them, the contribution of status must be excluded.
42
The trouble is that socioeconomic status is also a
result
of cognitive ability, as people of high and low cognitive ability move to correspondingly high and low places in the socioeconomic continuum. The reason that parents have high or low socioeconomic status is in part
a function of their intelligence, and their intelligence also affects the IQ of the children via both genes and environment.
Because of these relationships, “controlling” for socioeconomic status in racial comparisons is guaranteed to reduce IQ differences in the same way that choosing black and white samples from a school for the intellectually gifted is guaranteed to reduce IQ differences (assuming race-blind admissions standards). But the remaining difference is not necessarily more real or authentic than the one we start with. This seems to be a hard point to grasp, judging from the pervasiveness of controlling for socioeconomic status in the sociological literature on ethnic differences. But suppose we were asking whether blacks and whites differed in sprinting speed, and controlled for “varsity status” by examining only athletes on the track teams in Division I colleges. Blacks would probably still sprint faster than whites on the average, but it would be a smaller difference than in the population at large. Is there any sense in which this smaller difference would be a more accurate measure of the racial difference in sprinting ability than the larger difference in the general population? We pose that as an interesting theoretical issue. In terms of numbers, a reasonable rule of thumb is that controlling for socioeconomic status reduces the overall B/W difference by about a third.
Second version:
As blacks move up the socioeconomic ladder, do the differences with whites of similar socioeconomic status diminish?
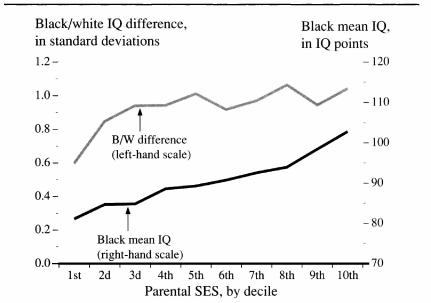
The first version of the SES/IQ question referred to the overall score of a population of blacks and whites. The second version concentrates on the B/W difference within socioeconomic classes. The rationale goes like this: Blacks score lower on average because they are socioeconomically at a disadvantage in our society. This disadvantage should most seriously handicap the children of blacks in the lower socioeconomic classes, who suffer from greater barriers to education and occupational advancement than do the children of blacks in the middle and upper classes. As blacks advance up the socioeconomic ladder, their children, less exposed to these environmental deficits, will do better and, by extension, close the gap with white children of their class.
This expectation is not borne out by the data. A good way to illustrate this is by using our parental SES index and matching it against the mean IQ score, as shown in the figure below. IQ scores increase with economic status for both races. But as the figure shows, the magnitude of the B/W difference in standard deviations does not decrease. Indeed, it gets larger as people move up from the very bottom of the socioeconomic ladder. The pattern shown in the figure is consistent with many other major studies, except that the gap flattens out. In other studies, the gap has continued to increase throughout the range of socioeconomic status.
43
Black IQ scores go up with socioeconomic status, but the black-white difference does not shrink
This question often arises in the context of black-white comparisons in America, the thought being that the African black population has not been subjected to the historical legacy of American black slavery and discrimination and might therefore have higher scores. Many studies of African students in primary and secondary schools, in both urban and rural areas, have included cognitive ability tests. As in the United States, it has been demonstrated in Africa that the same test items that discriminate best among blacks discriminate best among whites and that the same factors that depress white scores (for example, coming from a rural area) depress black scores. The predictive validity of tests for academic and job performance seems to be about the same. In general, the
psychometric properties of the standardized tests are the same for blacks living in Africa as for American blacks.
44
It has been more difficult to assemble data on the score of the average African black than one would expect, given the extensiveness of the test experience in Africa. In the same review of the literature that permitted the above generalizations, for example—a thirty-page article followed by a bibliography of more than 200 titles—not a single average is reported.
45
One reason for this reluctance to discuss averages is that blacks in Africa, including urbanized blacks with secondary educations, have obtained extremely low scores. Richard Lynn was able to assemble eleven studies in his 1991 review of the literature. He estimated the median black African IQ to be 75, approximately 1.7 standard deviations below the U.S. overall population average, about ten points lower than the current figure for American blacks.
46
Where other data are available, the estimates of the black African IQ fall at least that low and, in some instances, even lower.
47
The IQ of “coloured” students in South Africa—of mixed racial background—has been found to be similar to that of American blacks.
48
In summary: African blacks are, on average, substantially below African-Americans in intelligence test scores. Psychometrically, there is little reason to think that these results mean anything different about cognitive functioning than they mean in non-African populations. For our purposes, the main point is that the hypothesis about the special circumstances of American blacks depressing their test scores is not substantiated by the African data.
the Difference in Black and White Test Scores Diminishing?
The answer is yes with (as usual) some qualifications.
IQ T
EST
D
ATA.
The most straightforward way to answer the question would be to examine the repeated administrations of the same IQ tests to comparable populations, but large, nationally representative IQ data are not produced every year (or even every decade). The NLSY data are among the most recent for a young adult population, and they have a B/W difference toward the high end of the range. The only post-1980 study reporting black and white adult averages that we have found is the renorming of the Wechsler Adult Intelligence Scale (WAIS-R) in 1981 in which the difference between blacks and a sample of whites
(that apparently did not try to discriminate between Latino and Anglo whites) was 1.0 standard deviation.
49
Recent data on children tell opposite stories. In a review of IQ tests of children conducted since 1980, Ken Vincent of the University of Houston reports results for four normative studies that showed a B/W difference of only seven IQ points for the Ravens Standard Progressive Matrices (SPM) and the Kaufman Assessment Battery for Children (K-ABC).
50
Two other studies involving the Stanford-Binet IV found B/W differences often points for children ages 7 to 11 and twelve points for children ages 2 to 6.
51
Qualifications must be attached to these findings. The B/W difference on the K-ABC normative sample has in particular been subjected to reexamination suggesting that the diminished gap largely reflected psychometric and statistical artifacts.
52
Nonetheless, the data on children that Vincent reviews may be read as encouraging. The most impressive of the findings is the comparatively small B/W difference of only seven IQ points on the Ravens SPM administered to 12-year-olds. This finding corresponds to Jensen’s 1992 study of black and white children in an upper-middle-class setting in which the difference on the Ravens SPM was similarly below the norm (a deficit corresponding to ten IQ points).
53
In contrast to Vincent’s optimistic conclusions, the NLSY shows a growing rather than a shrinking gap in the next generation of blacks and whites. As discussed in Chapter 15, the B/W difference between NLSY children is currently wider than the B/W difference separating their mothers.
A
CADEMIC
A
PTITUDE AND
A
CHIEVEMENT
T
ESTS.
The most extensive evidence of a narrowing black-white gap can be found in longitudinal data from the National Assessment of Educational Progress (NAEP), the American College Testing (ACT) examination, the SAT, a comparison of the 1972 and 1980 national high school surveys, and some state-level achievement test data. We review the NAEP and the SAT here, and others (which tell the same story) in Appendix 5.
The National Assessment of Educational Progress is an ongoing program sponsored by the federal government to monitor the academic achievement of the nation’s youth. It began in 1969, periodically testing 9-, 13-, and 17-year-olds in science, mathematics, reading, and writing in nationally representative samples. The table below shows the changes from the first round of testing in 1969-1973 to the data for
1990, expressed in standard deviations. The “Change” column gives the later B/W difference minus the earlier B/W difference, which is negative if the gap is closing. The fourth component of the NAEP, a writing test, was introduced only in 1984, with replications in 1988 and 1990. Unlike all the others, it does not show a narrowing of the white-black gap (.46 SD in both 1984 and 1990) and is not included in the table.
| Reductions in the Black’White Difference on the National Assessment of Educational Progress | |||
|---|---|---|---|
| | White-Black Difference, in Standard Deviationsa | Change | |
| Source: National Center for Education Statistics, 199Ib. | |||
| The computations assume a standard deviation of 50. | |||
| | 1969-1973 | 1990 | |
| 9-year-olds | | | |
| Science | 1.14 | .84 | -.30 |
| Math | .70 | .54 | -.16 |
| Reading | .88 | .70 | -.18 |
| Average | .91 | .69 | -.21 |
| 13-year-olds | | | |
| Science | .96 | .76 | -.20 |
| Math | .92 | .54 | -.38 |
| Reading | .78 | .40 | -.38 |
| Average | .89 | .57 | -.32 |
| 17-year-olds | | | |
| Science | 1.08 | .96 | -.12 |
| Math | .80 | .42 | -.38 |
| Reading | 1.04 | .60 | -.44 |
| Average | .97 | .66 | -.31 |
| Overall average | .92 | .64 | -.28 |
