Read The Bell Curve: Intelligence and Class Structure in American Life Online
Authors: Richard J. Herrnstein,Charles A. Murray
Tags: #History, #Science, #General, #Psychology, #Sociology, #Genetics & Genomics, #Life Sciences, #Social Science, #Educational Psychology, #Intelligence Levels - United States, #Nature and Nurture, #United States, #Education, #Political Science, #Intelligence Levels - Social Aspects - United States, #Intellect, #Intelligence Levels
The Bell Curve: Intelligence and Class Structure in American Life (113 page)

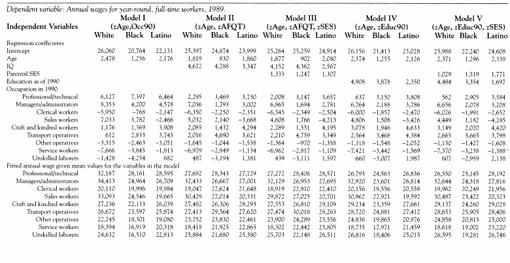
Table 6 shows the analysis of wages by ethnicity and occupational grouping based on the subjects occupation in the 1990 interview (the variable labeled “Occ90”), using the 1970 U.S. Census Occupational Classification System. The software used for these analyses, JMP 3.0, treats nominal variables differently from the convention in many other regression packages. See the introduction to Appendix 4 for details and an example.
Table 5 Income Analyses in Chapter 14 (in 1990 dollars), by Degree Attained
| Dependent Variable: | Annual Wages for Full-Time, Year-Round Workers, 1989 | Total Family Incomea | ||||
|---|---|---|---|---|---|---|
| Independent Variables | White | Black | Latino | White | Black | Latino |
| a For persons not out of labor force because of school in 1989 or 1990. | ||||||
| Intercept | 26,994 | 27,048 | 26,474 | 40,813 | 38,050 | 41,271 |
| Age | 2,338 | 787 | 2,207 | 2,583 | 946 | 3,091 |
| IQ | 3,082 | 3,802 | 2,507 | 3,025 | 4,247 | 4,136 |
| Parental SES | 914 | 840 | 1,248 | 3,648 | 5,191 | 2,042 |
| Highest degree attained | | | | | | |
| Less than high school | −4,992 | −3,688 | −1,588 | −9,743 | −4,181 | −9,461 |
| GED | −2,622 | −3,950 | −3,039 | −5,202 | −4,159 | −7,683 |
| High school diploma | −2,602 | −3,944 | −1,151 | −2,789 | −2,817 | −1,269 |
| Bachelor’s degree | 3,329 | 734 | 2,938 | 4,286 | 4,362 | 10,506 |
| Graduate degree | 6,887 | 10,848 | 2,840 | 13,448 | 6,795 | 7,907 |
| Minority income as a percentage of white income | | 100.2% | 98.1% | | 93.2% | 101.1% |
Sample sizes for the different occupations analyzed in Table 6 below are as follow:
| | White | Black | Latino |
|---|---|---|---|
| Professional/technical | 605 | 143 | 129 |
| Managers/administrators | 462 | 110 | 103 |
| Clerical workers | 473 | 260 | 172 |
| Sales workers | 163 | 34 | 30 |
| Craft and kindred workers | 370 | 113 | 106 |
| Transport operatives | 95 | 55 | 40 |
| Other operatives | 231 | 143 | 67 |
| Service workers | 289 | 218 | 95 |
| Unskilled laborers | 98 | 78 | 40 |
| Farmworkers | 22 | 4 | 12 |
Because of the small numbers of farmworkers, that category is omitted from the table. Note, however, that farmworkers were included in the actual regression equation; hence the coefficients for the nominal occupation categories will not sum to zero.
The Evolution of Affirmative Action in the Workplace
Much of the current debate about affirmative action in employment takes place in ignorance of the original objectives of affirmative action and the ways in which antidiscrimination law has evolved. Because we believe that returning to the original intention of affirmative action is a key to progress in social policy on many fronts and because our recommendation seems so radical in the prevailing context, this appendix presents a full discussion of the nature of the original objectives and the evolution as it pertains specifically to employment tests.
Affirmative action in the workplace, as distinguished from the broader and older civil rights movement, starts with Title VII of the Civil Rights Act of 1964. Title VII laid down principles of fair employment practice as regards race, religion, national origin, and sex, and it created the Equal Employment Opportunities Commission (EEOC) to administer and promote them. Besides Title VII (as amended over the years), affirmative action in the workplace comprises subsequent acts of Congress (and state legislatures), presidential executive orders, rulings by the EEOC and other branches of government, and landmark court cases. The basic intent of all of this energetic policymaking has been to make workplaces fairer to people from oppressed or mistreated groups.
As desirable as that goal may seem to just about anyone, a clear notion either of what it means or how to accomplish it does not emerge from the documents of this enormous (and spreading) battleground of law, regulation, litigation, and commentary. The good news is that many issues of fair employment practice need not concern us here.
1
But we cannot avoid looking at how Title VII (and its elaborations) dealt with the use of ability tests in the selection or promotion of employees. Although the tests are given to individuals, the groups of which they are
a part may average high or low compared to the population as a whole; as it happens, some of the groups who average low are protected from “unfair employment practices” by Title VII Hence the government gets into the business of regulating employment testing.
The ramifications of even the narrow issue of employment test regulation have ranged so far and wide that employment testing has become a new specialty in the creation and practice of law and in government regulation undreamed of by the Founders. Thousands, perhaps millions, of legislative and bureaucratic man hours have been lavished on it. Thousands of cases have been argued in court.
2
Doubtless many more cases have not been argued, as the specter of legal action has shaped innumerable decisions in corporate offices and boardrooms. The stance of the government and the courts has increasingly been to distrust tests that produce group differences, as if they presume that, in the absence of illegal discrimination, the groups should be equal.
Title VII of the 1964 Act specifically did
not
prohibit the use of employment tests, provided that the tests were not “designed, intended or used” to discriminate against people because of their race, color, religion, sex, or national origin. It said nothing about group differences, although it was clear in 1964 that ability tests would result in disproportionately fewer high scores for at least some of the groups of people protected from discrimination by the act. Some of the act’s proponents believed that some of the group differences in test scores were being used as a pretext for unfair discrimination; for that reason the act included a proviso regarding the tests. The hope was that Title VII would promptly eradicate this unfair use of tests. It was left to the EEOC to come up with the means of doing so.
In 1966, the EEOC formulated the first of a series of guidelines. An employment test, it ruled, had to have a proven power to measure a person’s “ability to perform a particular job or class of jobs.”
3
It was not enough, said the guideline, that the test be drawn up by professional testers; it also had to have some practical import—some “job relatedness,” in the evolving jargon of the field. Why this particular guideline? The answer is that staff for the newly launched EEOC had quickly become convinced that some employers were, as anticipated, hiding behind
the credentials of professional testers to use ability tests that had little bearing on job performance, and that they were doing so to discriminate against blacks.
4
The guideline was an attempt to pierce the veneer of professional respectability and thereby correct this violation of law and principle, as the EEOC saw it.
The criterion of job relatedness did not resolve the uneasiness about testing for the EEOC. Ability testing for employment had, after all, become an issue under Title VII because various groups of people get different average scores. This was the heart of the matter, and new guidelines laid down in 1970 addressed it frontally. For the first time, EEOC guidelines mentioned the issue of disproportionate success of different groups on any given test.
5
When a test “adversely affects” (more jargon, along with “disparate impact” or “adverse impact”) members of a protected group, said the new guidelines, it had to be shown not only that the test really did predict job performance but that the prediction was strong enough to make a significant economic difference and that no nondiscriminatory alternative was available. An employer, the reasoning went, may have abandoned older and cruder forms of deliberately discriminatory treatment of workers or job applicants (often called “disparate treatment”) but still be violating the intent of the law by using a needlessly discriminatory test. Disparate impact, in other words, was to be the red flag that set the EEOC in motion.
