Financial Shenanigans: How to Detect Accounting Gimmicks & Fraud in Financial Reports, 3rd Edition (42 page)
Authors: Howard Schilit,Jeremy Perler
Tags: #Business & Economics, #Accounting & Finance, #Nonfiction, #Reference, #Mathematics, #Management

Now, assume that in March 2005 (the first quarter after its acquisition by ACS), the target company generates $40 million in revenue as expected (the normal $30 million plus $10 million from the new contract). ACS, when calculating its own March 2005 internal revenue growth, logically should exclude this entire $40 million because none of it would have been included in ACS’s revenue absent the acquisition. However, ACS’s calculation allows the company to treat the new $10 million contract as part of its own internal growth. As a result, ACS’s internal revenue growth would improperly benefit from revenue that actually came from the acquired company’s business. Clearly, this is not an apples-to-apples comparison.
Tip:
Scrutinize the organic growth calculation of acquisitive companies as it may include revenue that spilled over from the target company.
Average Revenue per User
When comparing key non-GAAP metrics across a peer group, it is important to ensure that these metrics are being calculated in the same way. For example, in the broadcast industry, a common metric analyzed is ARPU (average revenue per user), calculated as total subscription revenue divided by average subscribers. Calculating the average revenue per subscriber sounds like it should be simple; however, varying definitions of ARPU abound. Consider, for example, the different definitions at competitors Sirius Satellite Radio Inc. and XM Satellite Radio Holdings Inc. (before they merged in 2008). Sirius’s calculation of ARPU included revenue from subscriptions, advertising, and activation fees. XM Radio, on the other hand, calculated ARPU using only revenue from subscriptions; advertising revenue and activation fees were excluded. (See the accompanying box.) In order to compare ARPU at the two companies on an apples-to-apples basis, investors must either adjust Sirius’s ARPU calculation to exclude advertising revenue and activation fees or adjust XM’s ARPU calculation to include these revenue sources.
AVERAGE REVENUE PER USER (ARPU) DIFFERENCES AT SIRIUS AND XM RADIO
Sirius’s ARPU Calculation: Subscriber (including offset for sales rebates)
activation
and
advertising revenue
divided by the daily weighted average number of subscribers for the period. [Italics added for emphasis.]
XM radio’s ARPU Calculation: Total monthly earned subscription revenue net of promotions and rebates divided by monthly weighted average number of subscribers for the period reported.
Source:
“Satellite Radio Industry Analysis” RiskMetrics Group April 2006.
Subscriber Additions and Churn
Let’s go back to our discussion of subscription-based businesses in the previous chapter. Since these types of companies (e.g., research providers, telephone companies, newspapers, fitness clubs, and so on) rely on new subscribers for growth, it is helpful for investors to monitor subscriber levels in order to get a sense of the most recent trends in the business. Logically, the number of new subscriber additions each quarter is often a good leading indicator of upcoming revenue. Similarly, the level of cancellations (called “churn”) is important to know when assessing the business. If a company shows a healthy subscriber base with growth in new subscribers and shrinking churn, investors can expect strong revenue growth ahead. That is, unless the company is manipulating these metrics.
Consider AOL Time Warner’s (AOL’s) scheme to inflate the number of subscribers to its online Internet service. One of the ways in which AOL sold subscriptions was to sell “bulk subscriptions” to corporations, which would then distribute these subscriptions to employees as a perk. AOL did not include these bulk subscription sales in its subscriber count because it knew that many of these subscriptions would never actually be activated. When employees did sign up, however, they rightfully entered the subscriber count.
In 2001, AOL was struggling to meet its subscriber targets. So, the company began including the number of bulk subscriber sales in its subscriber count, despite the fact that the majority of these subscriptions were never activated. Moreover, AOL would ship these bulk subscription membership kits to customers immediately before the quarter end in order to meet targets for subscriber count.
Adelphia Communications, the Rigas family business we introduced in Chapter 2 and the sixth largest cable company in the United States at the time, artificially inflated its subscriber counts by including subscribers of unconsolidated affiliates that had not previously been included in the count. For instance, in June 2000, Adelphia suddenly began including 15,000 subscribers of an affiliate in Brazil in its subscriber count. The very next quarter, Adelphia started including 28,000 subscribers of an unconsolidated Venezuelan affiliate.
Adelphia also decided to start including subscribers to other product lines in its count of basic cable subscribers. In June 2001, for example, Adelphia somehow thought it was appropriate to include 27,000 Internet service subscribers in its count of basic cable subscribers. To top it off, the company added 60,000 home security subscribers to its basic cable count in September 2001.
Pegasus Satellite Communications, a satellite television company, also manipulated its subscriber data in the years leading up to its 2004 bankruptcy filing. Normally, Pegasus’s subscriber billing system would automatically remove from the subscriber base any customers with bills that were overdue by 54 days. In order to keep the churn level down and inflate subscriber counts, Pegasus employees manually overrode the subscriber billing system, allowing customers to go well beyond the 54-day limit before being removed from the subscriber base.
Tip:
Subscriber data are often disclosed in both the earnings release and the 10-Q. Look for inconsistencies between the two sources, particularly discrepancies in which subscribers are shifted between categories.
Bookings and Backlog
Many companies disclose their quarterly “bookings” or “orders,” which are supposed to represent the amount of new business booked
during the period
. Companies may also disclose their backlog, which essentially represents their outstanding book of business or, in other words, all past orders that have yet to be filled (and recognized as revenue). “Book-to-bill” is also a common disclosure that compares current-period bookings to current-period revenue and is calculated as bookings divided by revenue.
If they are presented accurately, bookings and backlog are important indicators, as they provide investors with extra insight into upcoming revenue trends. However, since they are non-GAAP metrics, companies have plenty of leeway in how they define and disclose bookings and backlog. You would think that the calculations would be pretty straightforward, but indeed there are plenty of nuances in what should and should not be included. For example, different companies include the following types of orders differently in their presentation of bookings and backlog: cancelable orders, orders in which the quantity purchased is not defined, bookings for longer-term service or construction contracts, contracts with contingencies or extension clauses, bookings on noncore operations, and so on.
The varying definitions of bookings and backlog across companies make it extremely important for investors to understand exactly what the metric represents before putting any faith in it. Moreover, if the metric is a key performance indicator for a company, investors should use extra diligence to ensure that the company does not change its own definition of bookings in a way that flatters the metric.
2. Highlighting a Misleading Metric as a Surrogate for Earnings
Investment guru Warren Buffett (chairman of Berkshire Hathaway) has long poked fun at management teams that create dishonest pro forma metrics. He memorably compared this practice to an archer who shoots an arrow into a blank canvas and then draws a bull’s eye around the implanted arrow.
Accounting Capsule: Bookings and Backlog
The following formula shows the general relationship between bookings, backlog, and revenue (for all revenue streams that run through backlog). This formula is very helpful when analyzing companies, as it can be used to test the veracity or consistency of these non-GAAP metrics. It can also be used to calculate bookings when only backlog is given.

EBITDA and Its Variations
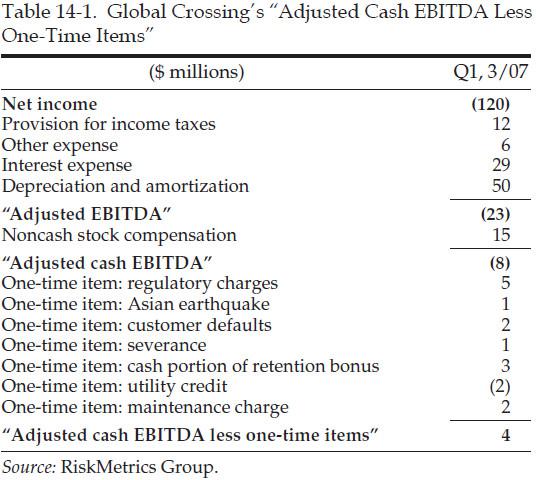
Consider the bull’s-eye drawn by the archers at Global Crossing. The company reported a net loss of $120 million in the March 2007 quarter. Desperate to show a profit, however, management removed expenses using a pro forma concoction reminiscent of its bad behavior during the dot-com bubble. First, management removed $97 million in expenses for interest, taxes, depreciation, and some other items to get to a metric it called “adjusted EBITDA” (earnings before interest, taxes, depreciation, and amortization). Then, it removed $15 million in noncash stock compensation expense, bringing the company to an “adjusted cash EBITDA” of negative $8 million. Close, but not all the way to profitability, management then removed a host of charges that it deemed one-time in nature, propelling the company to a positive $4 million in what it called “adjusted cash EBITDA less one-time items.” Bull’s-eye!
It is easy to be skeptical about Global Crossing’s three levels of pro forma, and it is hard not to laugh when looking at some of the “one-time” charges that the company removed. (See Table 14-1.) Last time we checked, expenses for “maintenance” are a normal cost of doing business and therefore should never be excluded from a pro forma calculation. Ditto for customer defaults (bad debts), employee retention bonuses, and routine regulatory charges. Do not be fooled into thinking that these items will not recur just because management decides to present them as one-time in nature.
Now You See It, Now You Don’t.
On its June 2007 earnings call, flash memory manufacturer Spansion proudly stated that EBITDA grew to $72 million from $61 million the quarter before. The following quarter, Spansion reported that EBITDA fell to $71 million; however, the company soothed concerned investors by claiming that EBITDA actually increased by $8 million if you exclude a onetime real estate gain received in the previous quarter. Conveniently, this one-time gain was not excluded from EBITDA when earnings were reported the previous quarter. So, Spansion essentially included the one-time gain to help show strong EBITDA growth in June, and then excluded the gain the next quarter in order to show strong EBITDA growth in September. You can’t have it both ways!
Pro Forma Earnings/Adjusted Earnings/Non-GAAP Earnings
What’s in a name? That which companies call earnings, by any other name would smell as sweet . . . or so management would like you to think. Sometimes management insists that a foul-smelling “pro forma” or “adjusted” earnings metric (or any other earnings metric with a qualifying name) is a sweet and pure measure of earnings.
Pretending That Recurring Charges Are One-Time in Nature.
Remember our friends at Peregrine Systems who recorded bogus revenue and then tried to cover it up by fraudulently faking the sale of accounts receivable? Well, the company had so many bogus receivables that it also used pro forma tactics to hide the evidence of its chicanery. In addition to pretending to sell these receivables, Peregrine also took charges for these receivables, but inappropriately classified those charges as nonrecurring and related to acquisitions. This classification gave Peregrine the cover to exclude these charges from its pro forma earnings presentation so that investors would not be concerned (or at least those investors that always took the company at its word).